
Industry
Reinvesting and reimagining the enterprise network

The enterprise network is undergoing a transformation as companies rethink how they manage their networks and how far they should reach. As a result, businesses around the world are adopting a two-pronged approach to their enterprise network infrastructure investments – reinvesting in technologies that were delayed or postponed during the pandemic’s peak, and planning for a reimagined enterprise network that will support their business’s needs in the years ahead.

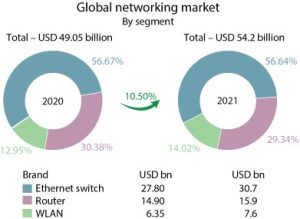
Amid the Covid-19 crisis, the worldwide networking market in 2021 is estimated at USD 54.2 billion, a 10.49-percent increase from USD 49.05 billion in 2020. The market shares of Ethernet switch, routers, and WLAN continued to constitute 57 percent, 29 percent and 14 percent respectively.
Enterprise networking vendors are evolving new business models to meet the demand of customers by offering new solutions that reduce cost, improve operational efficiency, and replace legacy network infrastructure.
With the ongoing technological breakthroughs in wireless LAN technology and high-speed Ethernet switches, the enterprise networking market is likely to grow. This technology is critical for the creation of smaller, more efficient chipsets and modules with additional capabilities. In coming years, rising demand for high-speed Ethernet switches is expected to open up new growth opportunities for the enterprise networking market players. In addition, government initiatives to ramp up digital transformation have increased the demand for routers, switches, and wireless LAN networks, which is expected to boost the market growth in the future.
Ethernet switch market
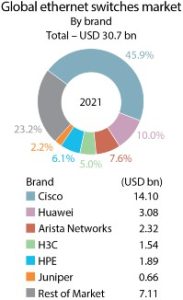
In 2021, the worldwide Ethernet switch market recorded USD 30.7 billion in revenues for a year-over-year (YoY) growth rate of 9.7 percent.
 Petr Jirovsky
Research Director,
IDC
“The Ethernet switch market’s growth in the final quarter of 2021 led to a strong growth rate for the full year, with generally positive results across the globe. Varying factors continue to drive the Ethernet switch market, including adoption of 400 GbE in the datacenter segment and continued growth of multi-gigabit Ethernet switches in the campus and branch segment of the market.”
From a geographic perspective, the Ethernet switch market experienced growth in most regions in 2021. In the United States, revenues rose 12.2 percent YoY in Q4 21 and increased 7 percent for the full year. The market in Latin America grew 3.4 percent YoY in the quarter and rose 7.7 percent for the full year. And Canada’s market grew 7 percent in Q4 21 but was down 1 percent for the full year. In Asia-Pacific (excluding Japan and China), the market rose 24.9 percent YoY in Q4 21 and grew 15 percent annually in 2021. The market in the People’s Republic of China (PRC) grew 21.1 percent in the quarter and rose 17.5 percent for the full year. Japan’s market declined 14.3 percent in the quarter and fell 0.8 percent for the full year.
In Western Europe, Ethernet switch market revenues grew 14.7 percent YoY in Q4 21 and were up 17.7 percent for the full year. In Central and Eastern Europe, growth was more modest at 3.7 percent in the quarter and 0.3 percent for the full year. In the Middle East and Africa, the Ethernet switch market declined 9.9 percent in the quarter and fell 5.4 percent for the full year.
Overall port shipments increased 13 percent in Q4 21 and rose 16.2 percent on an annualized basis in 2021, with growth in both the non-datacenter and datacenter portions of the Ethernet switch market. Non-datacenter Ethernet switch revenues grew 12.1 percent YoY in Q4 21 with port shipments increasing 14.6 percent. For the full year, revenues rose 10.5 percent in non-datacenter switching and port shipments rose 18.5 percent. The non-datacenter Ethernet switch portion of the market made up 88.3 percent of port shipments and 57.3 percent of total market revenues in Q4 21, with the balance of revenues and port shipments in the datacenter portion of the market. In the datacenter segment, market revenues rose 11.5 percent in the quarter and increased 8.5 percent for the full year, while port shipments grew 1.7 percent for the quarter and 2 percent on the year.
Market revenues for 200/400 GbE switches grew 40.4 percent from the third quarter to the fourth quarter of 2021, with port shipments increasing 22.9 percent on a sequential basis. 100GbE revenues increased 17.2 percent YoY in Q4 21, while port shipments rose 17.3 percent. 100GbE accounts for just under a quarter (24.7%) of the market’s total revenues. 25/50GbE revenues increased 21.8 percent YoY in Q4 21, while port shipments rose 2.6 percent. Lower-speed switches, a more mature part of the market, saw mixed results. 1GbE revenues increased 6.2 percent YoY in Q4 21 and port shipments rose 12.8 percent; 1GbE switches make up a third (33.4%) of the total market’s revenues. 10GbE, which makes up 22.4 percent of the total market’s revenues, declined 5.5 percent in the quarter, while port shipments grew slightly at 0.9 percent YoY. 2.5/5GbE switch revenues increased 23.5 percent sequentially from Q3 21 to Q4 21, while port shipments rose 21.6 percent quarter over quarter (QoQ).
 Brad Casemore
Research Vice President, Datacenter and Multicloud Networks,
IDC
“Organizations of all sizes around the globe are prioritizing connectivity as a critical component of their digital infrastructure strategies, and that is why we are seeing solid growth in the Ethernet switch market. The Ethernet switch market faces challenges in 2022, most notably from component shortages impacting supply chains, as also from the economic uncertainty associated with geopolitical conflict. These headwinds will be counterbalanced by the continued buildout of high-speed datacenter network capacity at hyperscalers and other major cloud providers in the quarters ahead.”
Company highlights
Cisco’s Ethernet switch revenue increased 3.4 percent for the full year in 2021, giving the company market share of 45.9 percent to finish 2021.
Huawei’s Ethernet switch revenue grew 8.3 percent for the full year, giving the company market share of 10.0 percent for the full year 2021.
Arista Networks saw Ethernet switch revenue increase 27.7 percent for the full year, giving the company 7.6 percent market share in 2021.
H3C’s Ethernet switch revenue increased 17.9 percent for the full year, giving the company market share of 5.0 percent to end 2021.
HPE’s Ethernet switch revenue grew 16.7 percent for the full year, giving the company market share of 6.1 percent in 2021.
Router market
In 2021, the total worldwide enterprise and service provider (SP) router market is estimated at USD 15.9 billion, a 6.5-percent increase compared to 2020. The service provider router revenues increased 7.9 percent, while the enterprise segment saw router revenues grow 2 percent.

Company highlights
Cisco’s combined service provider and enterprise router revenue rose 12 percent for the full year. Cisco’s combined SP and enterprise router market share stood at 34.6 percent to end the year.
Huawei’s combined service provider and enterprise router revenue increased 0.5 percent YoY and declined 1.2 percent for the full year, giving the company 30.5 percent market share in 2021.
In combined service provider and enterprise routing market, H3C’s revenue increased by 33.7 percent for the full year, giving the company 2.2 percent market share for 2021.
WLAN market
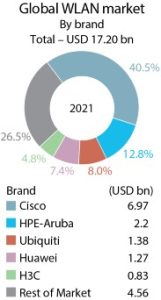
In 2021, the worldwide revenue for the combined consumer and enterprise wireless local area network (WLAN) market is estimated at USD 17.2 billion, a 6.5-percent increase compared to 2020. For the full year 2021, enterprise WLAN revenues increased 20.4 percent compared to 2020 and reached USD 7.6 billion. The consumer segment of the WLAN market declined 10.1 percent YoY in Q4 21 and fell 2.5 percent for the full year.
Growth in the enterprise WLAN market continues to be driven by the latest Wi-Fi standard, known as Wi-Fi 6 or 802.11ax. Wi-Fi 6 access points made up 75.1 percent of the revenues in the Dependent Access Point (DAP) segment, and accounted for 61.3 percent of unit shipments within the segment. Wi-Fi 5 products, also known as 802.11ac, made up most of the remaining balance of DAP sales. Meanwhile, the decline in the consumer-class WLAN market was largely due to difficult comparisons to the strong results in 2020, when consumers upgraded their wireless connectivity in response to the pandemic. Compared to the full year 2019 (before the pandemic), the consumer market grew 12.6 percent in 2021, indicating that the market’s fundamentals remain strong. Wi-Fi 6 products continued to grow in the consumer market, rising to make up 28.2 percent of the consumer segment’s total revenue and 13.1 percent of shipments. Wi-Fi 5 APs still make up the majority of revenues (61.4%) and unit shipments (63.6%).
From a geographic perspective, the enterprise WLAN market grew across most regions of the world. The market was particularly strong in the People’s Republic of China, which saw YoY growth of 50.5 percent in Q4 21 and 47.2 percent for the full year. In the broader Asia-Pacific region, excluding China and Japan, the market increased 16 percent for the full year.
The enterprise WLAN market in the United States rose 14.6 percent for the full year. The market in Latin America rose 33 percent in 2021. In Western Europe, the market grew 22.9 percent for the full year; in Central and Eastern Europe the market grew 10.6 percent for the full year. In the Middle East & Africa, the enterprise WLAN market rose 6.6 percent in 2021.
Company highlights
Cisco’s enterprise WLAN revenues rose 14.2 percent for the full year. Cisco ended 2021 with 40.5-percent market share, down slightly from the 42.7-percent market share in 2020.
HPE-Aruba revenues increased 14 percent for the full year. The company’s market share was 12.8 percent in 2021, down slightly from 13.5 percent in full year 2020.
Ubiquiti enterprise WLAN revenues increased 14.7 percent for the full year, giving the company 8 percent market share in 2021.
Huawei enterprise WLAN revenues rose 44.4 percent in 2021, giving the company 7.4-percent market share for the full year, up from 6.2-percent market share in 2020.
H3C revenues rose 33.7 percent for the full year, giving the company 4.8-percent market share for the full year, up from 4.3 percent in 2020.
Server market
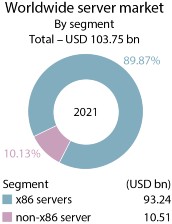
The global server market weathered the pandemic market shock in 2020, and subsequently the economic turmoil and supply chain disruptions during 2021, growing at over 6 percent YoY in each of these two years.
Vendors’ revenue in the worldwide server market is estimated at USD 103.75 billion in 2021. Revenue generated from x86 servers is estimated at USD 93.24 billion and non-x86 server revenue as USD 10.51 billion.
The market faces continued challenges in 2022, including an unresolved pandemic, historically high inflation, supply chain disruption, and geopolitical conflict. However, the server market has proven very resilient in recent years, as IT infrastructure has evolved from a nice-to-have or add-value to becoming a mission-critical investment for most organizations. While the nature of investment and workload choices may be impacted by economic and other pressures, overall, the market is expected to continue on a growth trajectory.
An aging installed base is primed for refresh in 2022, although it may spill into 2023. Large cloud service providers will continue their refreshes and expansions steadily through 2025.
Recovery from the Covid-19 pandemic is uneven across geographies as the impact of the virus and the reactions of governments have been varied. However, the overall impact of the pandemic seems to be diminishing.
Supply chain concerns came to a head between Q3 and Q4 of 2021, when inventories were depleted, and delivery depended on components coming in on time. However, the market still experienced high single-digit YoY growth in both quarters. Reports from the market were, however, that backlogs were increasing during this time, leading to the conclusion that demand has been growing even faster than the market is demonstrating. If the supply chain can turn a corner around mid-year as previously expected, this pent-up demand should be a driving force of additional growth in 2022 and into 2023.
 Brandon Butler
Research Manager, Network Infrastructure,
IDC
“The enterprise segment of the WLAN market continued its steady rebound in the final quarter of 2021, leading to a significant full-year growth rate for the industry in 2021. The growth rates indicate that organizations across the globe are reinvesting in their connectivity strategy and prioritizing wireless-first access in the local area network as a key part of their digital transformation goals.”
Worldwide external OEM storage systems market
The global market revenue for enterprise external OEM storage systems is estimated at USD 31,216 million in 2021. Following weak market performance in 2020 due to the beginning of the Covid-19 pandemic, the ESS market showed strong recovery, growing 6.8 percent in 2021; despite roadblocks created by continuous disruptions in the supply chain, demand for storage remains strong, but the market faces a range of challenges and uncertainties in 2022.
While many countries are recovering from the pandemic easing the restrictions, the impact of the pandemic continues to rattle some regions with occasional (mostly short-term at this point) lockdowns.
Historic high inflation hit the largest regional markets. Supply chain disruptions are not yet resolved. And all these challenges were exacerbated by the military conflict between Russia and Ukraine and subsequent sanctions. The tragic events of the last month brought a new shockwave across the market adding new pressures on the supply chain, adjusting priorities in IT spending, and creating a range of other disruptions across the globe, which will have indirect impact on the market in and beyond 2022.
Overall, the storage systems market is more resilient to the negative forces than some other IT segments due to continuous business digitization, which relies on data. Moreover, some of the developments enable more infrastructure spending in some workloads, including security and data protection.
 Nabila Popal
Research Director, Mobility and Consumer Device Trackers,
IDC
“The fact that 2021 would have come in drastically higher if it were not for the supply constraints adds even more positivity to the healthy 5.7-percent growth we saw for 2021. To me, it gives a message that there is significant pent-up demand in almost all regions. Even in China, where there are some challenges around weakening consumer demand, the market performed much better in the fourth quarter than expected, 5 percent better to be exact, albeit still a YoY decline. With channel inventory low in almost all regions, and as supply constraints ease up toward the middle of the year, IDC expects this pent-up demand to drive the market toward healthy growth in 2022.”
HCP market
The worldwide hardcopy peripherals (HCP) market at 91.67 million units saw a 2.9-percent overall unit decline for the full year 2021. For the fourth quarter of 2021, the market saw unit shipments decline 17.6 percent YoY to 22.3 million units. Shipment value was also down 12.3 percent year over year during the quarter to USD 9.7 billion.
HP Inc. outperformed all other companies in the top six in terms of shipment growth, with worldwide shipments of 36.9 million units in the year. Canon group closed second at 16.6 million units and Epson at 18.4 million units. Other aggressive brands are Pantum, Brother, Lenovo, and Kyocera.
Smartphone market
The worldwide smartphone market will reach 1.38 billion units shipped in 2022, up 1.6 percent from the 1.35 billion units shipped in 2021. From there, shipments will hit 1.53 billion units in 2026, resulting in a CAGR of 2.3 percent.
There is no question the second half of 2021 failed to meet expectations with volumes declining 4.5 percent compared to the second half of 2020. The supply chain and component shortages started to have meaningful impact on the smartphone market as the market entered the second half of the year, and this continues to be the case as the industry now entered 2022. Expect to see supply and logistical challenges continue through the first half of this year, but IDC believes the market will return to growth in the second quarter and second half of 2022. There is no question that demand is still strong in many markets, and to some extent increasing consumer interest in 5G and new form factors like foldables can be seen.
Although the foldables are not expected to capture a significant share, with 7.1 million devices in 2021, they are expected to take over a third of the premium (USD 1000+) Android market. Total foldable shipments worldwide is expected to reach 27.6 million units by 2025, resulting in a CAGR of 69.9 percent for 2020–2025. So it will not be long before foldables, just like 5G, become a signature and expected feature of the premium Android market. While the importance of foldable is no longer in question to any brand that wants a share of the premium Android space, what is interesting to vendors now is the battle between the flip and the fold form factors. Current data suggests the flip version to be more popular. However, it is still too early in the game to declare a clear winner, and something vendors should continue to keep a close eye on as the total foldable market continues to grow and attract new vendors to the market.
In terms of vendors, despite a slight YoY decline in shipments, Apple had an impressive holiday quarter, once again jumping over Samsung into the top spot. Its strength in supply chain was on display more than ever in Q4 21. iPhone 13 SKUs were an impressive portion of volumes in the holiday quarter, driving strong growth in overall iPhone average selling prices. Samsung and Xiaomi followed with the second and third spots and it is worth noting these were the only vendors out of the top five that grew shipments YoY in Q4 21. OPPO and vivo rounded out the top five.
For the full year, all five vendors grew shipments YoY, with four out of five achieving double-digit growth. While Xiaomi had the highest annual growth, reaching almost 30 percent, Samsung had the lowest, just 6 percent growth in 2021. This contrast clearly illustrates which vendor benefitted the most from the massive decline of Huawei this year. Apple too had healthy annual growth of 15.9 percent in 2021 for reasons already mentioned as well as due to the superb 40 percent growth in China in 2021.
5G devices delivered a YoY growth of 117 percent in 2021, driven by a supply-side push from both vendors and channels. The shift to 5G translates to greater revenues for most vendors, compared to more affordable 4G devices, which saw a YoY decline of 22.5 percent in shipments. 5G-powered smartphones are estimated to have a USD 643 ASP in 2021, which is 1.7 percent higher than 2020, thanks to the massive success of iPhone 12 and 13 devices that are all 5G. By the end of 2025, IDC expects the 5G ASP to drop to USD 416. The ASP for 4G devices is estimated at USD 204 in 2021, down 26.5 percent compared to 2020, and fall to USD 109 by the end of 2025. China was the largest market for 5G smartphones in 2021, with 46.9 percent of shipments, followed by the United States at 16.1 percent and APeJC at 12.8 percent. However, China’s share is expected to drop to 30.5 percent by 2025 as other regions ramp up their 5G networks and connectivity.
Indian Market
The Indian networking market in 2021 is estimated at `8477.44 crore, a 13.91-percent increase from `7441.65 crore in 2020. While the market share of Ethernet switches remained in the vicinity of 50 percent and routers estimated at 27 percent, WLAN declined to 20 percent in 2021 from 22 percent in 2020.

Ethernet switch market
In 2021, the Ethernet switch market in India stood at `4440 crore (by vendor revenue), registering a 17.06-percent increase from `3792.85 crore in 2020. The enterprise investment in non-DC switching grew at a 41.5-percent YoY owing to offices getting ready to reopen post the third wave of Covid-19. With hybrid work taking precedence, enterprises are also keen on setting up satellite offices in Tier-II and Tier-III cities to promote employee satisfaction, which is also increasing the demand for non-DC switching equipment. With the semiconductor shortage situation intensifying, enterprises were keen on clearing their backlogs during Q4 21 to create room for future demand. The DC switching segment grew at 9.3 percent YoY. Services, telecom, manufacturing, and government were the top contributors in 2021.
 Sudharsan Raghunathan
Senior Market Analyst, Enterprise Networking,
IDC India
“Though vendors were struggling with operational challenges like ever-expanding lead times and increasing input costs, demand for network infrastructure remained healthy. The market for campus investments – both for wired and wireless business expanded rapidly during Q4 21. Vertical segments like education, which did not spend for a considerable period, started spending on network infrastructure. Cloud-managed infrastructure was gaining more traction than usual, considering the ease of deploying and managing infrastructure, specifically in verticals such as services, education, retail, etc. Enterprises are largely beginning to realize the benefit of NaaS as it would help them migrate to an OpEx model without compromising on the quality of service. Network infrastructure vendors are gearing up to cater to specific demands on the enterprises by building easy-to-use management consoles and flexible commercial models as part of their NaaS offerings.”
Cisco continued to dominate the Ethernet switch market with a 59-percent share in 2021, followed by Hewlett Packard Enterprise (HPE) and Juniper. ODM business in India had a significant growth during Q4 21 owing to the hyperscaler investments.
Router market
The India router market in 2021 stood at `2313.24 crore (by vendor revenue), with a robust growth of 15.02 percent over 2020. The noticeably high growth was due to the weak base, caused during the first wave of the pandemic. Both the enterprise and service provider investments in routing grew by 20.3 percent and 18 percent YoY, respectively. Telecom vendor investments were mostly centered around refreshes, bandwidth optimization requirements, building edge clouds, investments ahead of 5G rollouts, and deployments aimed at SD-WAN implementation. Apart from telecom, the key investment areas included professional services and process manufacturing. Investment from the government sector picked up during Q1 2021, making it one of the top business verticals followed by banking.
Cisco leads the router market, followed by Nokia and Juniper.
WLAN market
In 2021, the Indian WLAN market was valued at `1724.2 crore (by vendor revenue), with enterprise wireless segment accounting for the majority of the revenue. The growth was majorly driven by enterprises investing in wireless infrastructure ahead of office opening post the third wave of Covid-19. Vendors were also focused on clearing the existing backlogs caused by chip shortages to be able to efficiently cater to future demand. Services organizations were seen investing heavily on spinning up newer locations primarily focusing on wireless connectivity. Cloud-managed wireless was witnessed gathering stream owing to simpler deployment and management. Investments from the education vertical bounced back after a long slump caused due to Covid-19. Wi-Fi 6 contributed to 75.7 percent of the access point revenues due to lesser wait times compared to the previous generations of wireless access points.
 Dileep Nadimpalli
Research Manager, Enterprise Infrastructure,
IDC India
“The pandemic has accelerated the digital transformation initiatives, but to drive successful transformation, organizations need to modernize their applications/infrastructure; provide seamless access to data; continuous optimization, and next-generation security, all with ease of management and at a reduced cost. Enterprises are in search of an intelligent infrastructure platform, which can enable them in their transformation journey.”
The consumer gateway router business declined sharply in 2021. The decline in the gateway router segment was due to offices opening in multiple parts of the country, and the festival season coming to an end in India. With ISP as the channel, Wi-Fi 6 is starting to get traction in the consumer segment as well. However, the gateway router market is still dominated by Wi-Fi 5 shipments.
With a significant increase in demand for consumer gateway routers, TP-Link was the market leader, followed by D-Link. Cisco was the market leader in the enterprise class WLAN segment, followed by Hewlett Packard Enterprise.
The pandemic had a significant impact on Indian enterprises, especially in the small and medium business space. While enterprises clearly understand that network transformation is imperative to stay abreast in the current business landscape, they are not in an immediate position to incur huge capital expenditures. Connectivity as a service option will largely assist these organizations to navigate this challenge. The vendor landscape has been very actively positioning the network-as-a-service (Naas) model to SMBs in partnerships with telcos and ISPs. This will enable enterprises navigate the challenges around over-provisioning of resources, filling the skill gap, and access to SLA-driven connectivity without incurring heavy one-time expenditures.
The overall market, encompassing all elements of networking, bounced back strongly to pre-pandemic levels for the first time in six quarters, anticipating 2022 to be a year of growth. The Non-DC/campus market will act as the key factor determining the course of the market. However, a lot depends on the new variant of the virus and its impact on the Indian enterprises
The Ethernet switch, router, and WLAN markets are expected to grow in single digits in terms of compound annual growth rate (CAGR) for 2021–2026. Increased adoption of emerging technologies, such as cloud, IoT, and mobility, would drive incremental revenues. Large investments for 5G rollouts are also expected in the next couple of years.
Server market
During July 2020 to June 2021, the Indian server market is estimated at `8490 crore.

The x86 server market contributed to 90.7 percent of the revenue, estimated at `7703.4 crore. The highest contribution in the x86 market mainly came from professional services, telecommunications, discrete manufacturing, and banking verticals. The professional services vertical spending was led by investments from fintech, cloud service providers (CSPs), telecom players, and IT/ITeS companies. In addition, increasing focus on digitization and modernization has led to higher investments from banking and discrete manufacturing as well.
The x86 server market increased YoY by 12.3 percent in terms of revenue to reach `1935.84 crore in Q2 2021 from `1723.46 crore in Q2 2020. During Q2 2021, verticals such as insurance, media, and resource industries witnessed the highest YoY growth in terms of revenue.
The non-x86 server market declined to reach `786.62 crore in revenue during July 2020 to June 2021. IBM continues to dominate the market with 55.8 percent of revenue share, during July 2020 to June 2021, with an absolute revenue of `438.82 crore. Oracle came at second position, followed by Hewlett Packard Enterprise (HPE), with a revenue share of 15 percent and 10.6 percent, respectively.
Company highlights
During July 2020 to June 2021, Dell Technologies emerged as the top vendor in the India x86 server market with a revenue share of 30.5 percent and revenue of `2314.72 crore. The top three verticals for Dell Technologies were professional services, banking, and telecommunications. Hewlett Packard Enterprise (HPE) came at the second spot with a revenue share of 18.48 percent and absolute revenue of `1423.76 crore. The key verticals for Hewlett Packard Enterprise were telecommunications, professional services, and discrete manufacturing. Lenovo and Cisco came in third and fourth position respectively with a revenue share of 14.95 percent and 7.6 percent, and absolute revenues of `1151.44 crore and `586.08 crore, respectively.
 Bani Johri
Market Analyst, IPDS,
IDC India
“At 66.7-percent market share, the Laser A4 multifunction printer segment recorded its highest market share till date. For some brands, like HP, it resulted from strategic decisions to pull certain 12A toner-based printers out of the market. For others, such as Brother, it was a result of multiple stringent lockdowns in Vietnam, the production hub of certain single-function machines by the vendor. Within the laser copier segment, certain brands performed very well in the color category, thus bringing up the overall market share of the color category in laser copiers to 15.2 percent, being highest till-date. This follows acceptance of new models launched last year and lucrative pricing options offered.”
India’s external storage market
India’s external storage market is valued at `2321.38 crore in 2021 (July 2020 to June 2021). The year witnessed YoY growth in storage spending from the government and manufacturing verticals, while observed a sharp decline in contribution from BFSI, professional services, and telecommunications verticals.
The growth of All-Flash Arrays (AFA) is evident across verticals. BFSI, professional services, manufacturing, and government verticals were the major contributors to AFA demand. The emergence of NVMe flash media would further drive the AFA market due to better cost versus performance ratio across verticals.
Enterprises are forced to change their existing IT architectures to be adaptive and efficient while securing the workloads. Additionally, workloads are getting distributed to the edge, which is complicating things more for organizations. Enterprises are looking for an infrastructure platform, which offers complete end-to-end data services along with built-in security features.
Dell Technologies continued to be the market leader in the external storage systems market by vendor revenue, followed by HPE.
HCP market
India’s hardcopy peripherals (HCP) market registered a shipment of 3.48 million units in 2021 (July 2020 to June 2021).
The market registered a shipment of 0.7 million units in Q2 21 (April–June), declining by 24.1 percent QoQ. However, from a YoY perspective, the market posted a growth of 103.5 percent in the April–June quarter. This highest-ever recorded growth rate is accounted for by the extremely shallow base last year in Q2, due to the country-wide lockdown.
The inkjet segment noted a YoY growth of 71.9 percent, accounted partly by the low shipment units in Q2 20, and partly by the continued demand from the home segment in Q2 21. As schools and colleges were forced to continue the virtual classes, demand from parents and students remained strong.
However, this demand could not be fully fulfilled because of the disruption in the local supply chain due to lockdown in multiple states owing to the second Covid-19 wave. In addition, the chip-shortage issue has also been plaguing the industry, already resulting in brands struggling to stabilize the supply of in-demand ink tank printers specifically.
The laser printers segment (including copiers) recorded a YoY growth of 175.1 percent on the back of a strong showing of laser printers (excluding copiers) since SOHOs (small offices, home offices), SMBs, and few medium-sized corporates did not shut down operations completely during the second wave, unlike last year. The laser copier segment observed a minor YoY growth of 27.8 percent as most enterprises extended work-from-home for their employees during the second wave.
By brand
HP Inc. (excluding Samsung) maintained its leadership in the overall HCP market with a share of 38.8 percent. The exponential growth follows the acute supply shortage HP faced in Q2 20.
 Navkendar Singh
Research Director, Client Devices & IPDS,
IDC India
“Overall, supply challenges and the second wave of Covid-19 severely restricted the market’s ability to achieve double-digit growth in 2021. Consumer demand is lower than expected as we entered 2022, but supply challenges are expected to ease by mid-2022, which should help in maintaining similar growth levels in 2022.”
Epson occupied the second position in the overall HCP market with a market share of 26.59 percent in the period July 2020-21. During Q2 21, in the inkjet segment, Epson maintained its top position in the market with a share of 47 percent. The fact that Epson did not face a major supply shortage of its fast-moving models through the quarter contributed to their growth.
Canon occupied third position in the overall India HCP market, capturing a unit market share of 23.28 percent in the period July 2020 to June 2021. And in Q2 21, in the inkjet segment, Canon observed a YoY growth of 64.1 percent on the back of its ink cartridge segment, even though it struggled with the supply shortage of certain ink tank models. In the laser segment (including laser copiers), Canon maintained its second position with a market share of 25 percent while struggling with the supply of its highest-selling models. In the laser copier segment, Canon grew by 43.2 percent YoY and continued to lead the copier segment with a 35.8 percent market share.
Smartphones market
India shipped 161 million smartphones in 2021. This was up by 7 percent YoY, even as supply and pandemic-related challenges created disruptions during the year. 2021 started strong with pent-up demand from H2 20 (July–December) and positive sentiments around vaccinations but a severe second wave of Covid-19 dealt a blow to the growth. Constrained supplies resulted in low inventories across channels in the second half of the year, which usually has a high demand during the festive season.

Q1 22 (January–March) is expected to remain flat YoY amidst a low seasonal demand and a mild impact of the ongoing third wave of Covid-19, which will give the brands time to replenish their inventories. The transition from 4G to 5G will continue to drive growth, though still restricted to mid and high-tier price segments.
With 81 million units, the online channel registered a 13-percent YoY growth, surpassing the offline channel. This was driven by heavy marketing and initiatives like multiple sales festivals, attractive financing schemes, cashback and exchange offers, and trade-in programs. While the offline channel contracted in 2021, IDC expects offline shipments to recover some lost ground in 2022.
MediaTek-based smartphones recorded a 54-percent market share, creating a bigger lead over Qualcomm with more than 85 percent of its smartphones below USD 200. UNISOC regained some momentum reaching a 7-percent share, up from 2 percent in the previous years.
ASPs peaked at USD 190, growing by 15 percent annually. The share of the premium segment doubled from a year ago to 4 percent in 2021, growing by more than 100 percent annually, largely due to higher Apple shipments. The sub-USD 100 was the only segment to decline YoY. ASPs in 2022 are expected to be high due to the rising cost of components and higher share of 5G smartphones.
By brand – Top 5 smartphone vendor highlights
Xiaomi maintained its leadership position for four consecutive years with 40 million units, though declining by 1.5 percent YoY in 2021. Poco, Xiaomi’s sub-brand, emerged as the fastest-growing online brand amongst the top five with 51 percent YoY growth. The entry-level models, Redmi 9A/9 and Power/9, were the major volume drivers. Better supplies and a focus on offline channels should help drive growth for Xiaomi in 2022.
 Harish Krishnakumar
Senior Market Analyst,
IDC India
“The accelerated adoption of public cloud is expected to continue in the upcoming years as enterprises expedite their digital transformation initiatives by increasingly leveraging emerging technologies, with public cloud being the bedrock, to improve business resiliency and deliver enhanced customer experience. With many businesses expected to transition to a hybrid work model in the upcoming months, this would result in an increase in public cloud investments due to the demand for remote compute and storage, conferencing and collaboration applications, VDI, cloud security, etc.”
Samsung, at the second slot, registered a YoY decline of 6 percent in 2021, shipping 28 million units. There were persistent supply constraints, especially for Galaxy A series in the low- to mid-price segment, and for foldable devices in the premium segment.
However, Samsung led the 5G segment with a 21-percent share, driven by Galaxy A22, M32, and M42. A renewed focus on offline shipments in 2022, along with the momentum it has gained in the online segment, should help Samsung stay in a strong position in 2022.
Vivo was at the third position, with a shipment decline of 6 percent YoY, though it continued to lead with a 28-percent share of offline channel shipments in 2021. Its Y series continued to be a major contributor; however, it faced supply challenges as well. Vivo could leverage its sub-brand iQOO to expand its online presence and garner share in 2022.
Realme at the fourth slot registered the highest growth of 26 percent YoY amongst the top five vendors. It also rose to the second slot in Q4 21(October–December), surpassing Samsung, with a share of 19 percent. In the online space, it continued to be at the second slot with a high 21-percent share in 2021. Realme’s UNISOC-based shipments reached 60 percent of its total, ensuring sufficient supplies in Q4 21.
OPPO, at the fifth slot, witnessed a healthy growth of 8 percent YoY in 2021 to 18 million units. It also surpassed Samsung for the second slot annually in the offline channel with a share of 18 percent. With a larger focus on higher ASP devices like the Reno 6/7 series, OPPO’s play in the mid-premium segment has risen compared to previous years. However, its online presence remains limited.
Public cloud services market
India’s public cloud services (PCS) market, including infrastructure-as-a-service (IaaS), platform-as-a-service (PaaS), and software-as-a-service (SaaS) solutions, revenue totaled USD 2.2 billion for the first half of 2021. The overall Indian public cloud services market is expected to reach USD 10.8 billion by 2025, growing at a CAGR of 24.1 percent for 2020–2025.
SaaS continued to be the largest component of the overall public cloud services market, followed by IaaS and PaaS in H1 2021. Public cloud spending continued to increase among enterprises, with the top two service providers holding more than 49 percent of the Indian public cloud services market.
The impact of the Covid-19 pandemic continued to be the key driver of cloud adoption in H1 2021, as enterprises continued their investments in cloud infrastructure, platforms, and software to improve the resiliency of their business operations.
Apart from large enterprises, small and medium businesses also continued to witness a significant increase in public cloud adoption due to the demand for cloud-based applications for collaboration, enterprise resource management (ERM), and customer relationship management (CRM), security.
Cloud continues to be the foundational pillar for innovation, collaboration, and digital transformation, and is witnessing an accelerated adoption by enterprises in India. Organizations in India cite increased investment plans for cloud infrastructure and platforms in the coming 12 months to aid in faster and more effective ways of application development and access to technologies. Additionally, cloud-native services are becoming crucial for enabling new architectures and functionalities.
IT spending in India
IT spending in India is forecast to total USD 101.8 billion in 2022, an increase of 7 percent from 2021, anticipates Gartner, Inc. Indian CIOs are likely to increase their spending toward projects that drive innovation and modernizing legacy systems. Hiring a workforce that can deliver on these needs will also be a key priority. This year, Indian CIOs are prioritizing a move away from rigid and monolithic ways of doing business to a more composable business and IT architecture, where they will be able to respond better to disruptions.
| India IT spending
By segment – (USD mn) |
||||
| Segment | 2021 | Growth (%) | 2022 | Growth (%) |
| Communication Services | 24,000 | 4.4 | 24,551 | 2.3 |
| Data Center Systems | 2,764 | 5.7 | 2,859 | 3.4 |
| Devices | 41,040 | 14.0 | 44,132 | 7.5 |
| IT Services | 18,119 | 10.8 | 19,768 | 9.1 |
| Software | 9,188 | 17.0 | 10,507 | 14.4 |
| Total | 95,110 | 10.8 | 1,01,817 | 7.0 |
In 2022, all segments of IT spending in India are expected to grow, with software emerging as the highest-growing segment. Spending on software is forecast to total USD 10.5 billion in 2022, up 14.4 percent from 2021. While experiencing a slower growth rate than 2021, spending on software in 2022 is forecast to be nearly double of what it was pre-pandemic.
As hybrid work-adoption increases in the country, there will be an uptick in spending on devices in 2022, reaching USD 44 billion, an increase of 7.5 percent from 2021. The growth in devices is a combination of two components – hybrid work and pent-up demand from 2020 for device upgrades.
Despite a tough supply environment that is likely to endure for the most of 2022, the corporate network equipment market is expected to increase by double digits in sales. Healthy outlooks, offered by most suppliers as a consequence of enhanced visibility and substantial backlogs, underscore this optimism.
Furthermore, persistent supply issues will drive customers to place advance orders, which will have a favorable impact on bookings initially, and then revenues a few months later, depending on lead times. In general, 2022 is likely to be a dynamic year, with businesses preparing for a new normal in their enterprise network.
The article is based on research conducted by IDC in 2021.


You must be logged in to post a comment Login