
Industry
A dynamic year ahead!

With 2020 in the rear-view mirror, enterprises are eagerly looking ahead to a sharp recovery in 2021. Networking changed dramatically during the COVID-19 pandemic, with enterprises continuing to support more remote workers while increasing their reliance on multiple cloud platforms, and connectivity remaining as important as ever.
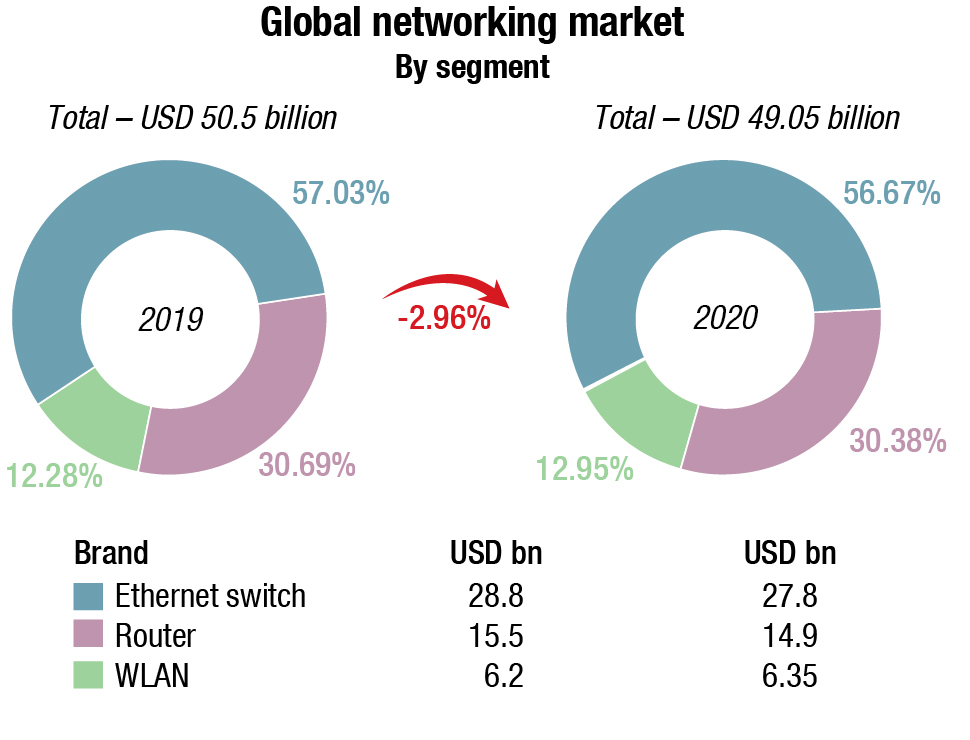
The global networking market in 2020 is estimated at USD 49.05 billion, a 2.96 percent decline from USD 50.5 billion in 2019. The market share of ethernet switch, routers and WLAN remained similar, at 57 percent, 30 percent and 13 percent respectively.
Ethernet switch market
The worldwide Ethernet switch market recorded revenues of USD 27.8 billion for 2020, a decline of 3.5 percent over 2019.
From a geographic perspective, the Asia-Pacific region, excluding Japan and China, declined 5.3 percent for the full year. China showed strong growth leading to full-year market growth of 12.3 percent. Japan also was up 11.1 percent for the year. In Central and Eastern Europe, 4Q20 revenues declined and were down 1.9 percent for the full year with Romania down 29.6 percent. Western Europe’s Ethernet switch market declined and was off 8.9 percent for the full year; In the Middle East and Africa, revenues were 2.9 percent lower in 2020 compared to 2019. The US market ended the full year with a decline of 6.6 percent. Canada’s market declined 9.6 percent on the year. Latin America’s market was off 20.4 percent for the full year.
Demand in the Ethernet switch market continues to be driven by the highest speed switching platforms. For example, port shipments for 100Gb switches constituted 23.7 percent of the market’s revenue. For the full year, 100Gb port shipments increased 40 percent in 2020 compared to 2019. 25Gb/50Gb switches also saw impressive growth with revenues increasing 33.5 percent to USD 655 million and port shipments growing 28.1 percent year over year. Lower-speed switches, a more mature part of the market, saw mixed results in port shipments and revenue as average selling prices (ASPs) in this segment continue to decline. 10Gb port shipments revenue declined 2.7 percent year over year. 10Gb switches make up 26.2 percent of the market’s total revenue. 1Gb switch port now accounts for 35.4 percent of the total Ethernet switch market’s revenue. In 2020, datacenter ethernet switches made up 14.1 percent of all port shipments but 43.6 percent of the year’s revenues. Non-datacenter switches, meanwhile, still account for the majority of the market’s shipments (85.9 percent) and revenues (56.4 percent).
 Brad Casemore
Research Vice President
Datacenter and Multicloud Networks, IDC
“The Ethernet switch industry continues to be a tale of two markets with higher-speed Ethernet switch ports proliferating in the datacenter and benefiting from demand from hyperscalers, tier-2 clouds, and some cloud-building large enterprises. Meanwhile, the more mature non-data center market in the fourth quarter of 2020 continued to be challenged by the impacts of the COVID-19 pandemic, which caused some organizations to postpone or reassess campus network investments as they adapt to a hybrid workforce.”
Company highlights
Cisco’s Ethernet switch revenues were down 9.5 percent for the full year 2020.
Huawei’s Ethernet switch revenue was up 4.8 percent for the full year. Huawei ended 2020 with market share of 10.5 percent.
Arista Networks’s Ethernet switch revenues declined 9.9 percent. 100Gb revenues account for 72.9 percent of the company’s total revenue, reflecting the company’s longstanding presence at hyperscaler datacenters, cloud providers, and large enterprises.
HPE’s Ethernet switch revenue gave the company a 1.9 percent full-year increase in 2020 compared to 2019. HPE ended the year with 5.8 percent market share.
Juniper’s Ethernet switch revenue was down 3 percent for the full year, bringing its market share to 3 percent to end the year.
Ethernet router market
The worldwide enterprise and service provider router market generated revenues of USD 14.9 billion, a decline of 4 percent compared to 2019, with the service provider segment down 2.9 percent and the enterprise segment declining 7.5 percent in 2020.
 Petr Jirovsky
Research Director
IDC
“From a geographic perspective, there was uneven growth across the globe in both the Ethernet switch and router markets, indicating the uneven impact that the COVID-19 pandemic continues to have on economies around the world. As enterprises and service providers look toward 2021, IDC expects the need for high-speed networking equipment to continue to drive these markets.”
Company highlights
Cisco’s combined service provider (SP) and enterprise router revenue was down 15.1 percent for the full year, giving the company 32.9 percent share in 2020.
Huawei’s combined SP and enterprise router revenue rose 6 percent for the full year, giving the company 32.9 percent market share for the full year.
Juniper saw a 0.7 percent decline for the full year, bringing its market share in the router market to 10.8 percent.
WLAN market
Worldwide revenue for the combined consumer and enterprise wireless local area network (WLAN) market segments grew 10.3 percent for the full year. The enterprise segment grew 1.9 percent for the full year 2020, reaching USD 6.35 billion.
A key driver for the enterprise WLAN market is the rapid emergence of the Wi-Fi 6 standard, also known as 802.11ax. The Wi-Fi 5 standard, 802.11ac, still makes up the majority of dependent AP shipments and revenues. Meanwhile, the consumer WLAN market continued to show strength and revenues increased 16.4 percent for the full year. Within the consumer market, 60.5 percent of shipments and 68.7 percent of revenues were for 802.11ac products, indicating the slower adoption of Wi-Fi 6 in the consumer market compared to the enterprise market. WLAN equipment supporting the older 802.11n standard still made up 32.9 percent of unit shipments and 15.1 percent of revenues.
From a geographic perspective, the WLAN market saw mixed results across the globe. In North America, the United States’ enterprise WLAN market grew 4.9 percent. Across Europe, Central and Eastern Europe’s enterprise WLAN market was up 1.5 percent for the full year. In Western Europe, the enterprise WLAN market was off 8.7 percent, and in the Middle East and Africa region grew 7 percent in 2020.
The Asia/Pacific region, excluding Japan and China, was slightly down, falling 7.6 percent for the full year. China ended the year strong with 3.1 percent growth while Latin America segment was down 8.1 percent in 2020, compared to 2019.
Company highlights
Cisco’s enterprise WLAN revenues ended 2020 with full-year revenues declining 2.5 percent. Cisco remains the market share leader, finishing the year with 42.7 percent share.
HPE-Aruba revenues declined 1.0 percent for the full year. The company’s market share remained at 13.5 percent to close 2020.
Ubiquiti enterprise WLAN revenues rose 22.3 percent for the full year, giving the company 8.4 percent market share.
Huawei full year, revenues were up 14.0 percent, giving the company 6.2 percent share to end the year.
CommScope (formerly ARRIS/Ruckus) revenues gave the company 4.8 percent market share.
Server market
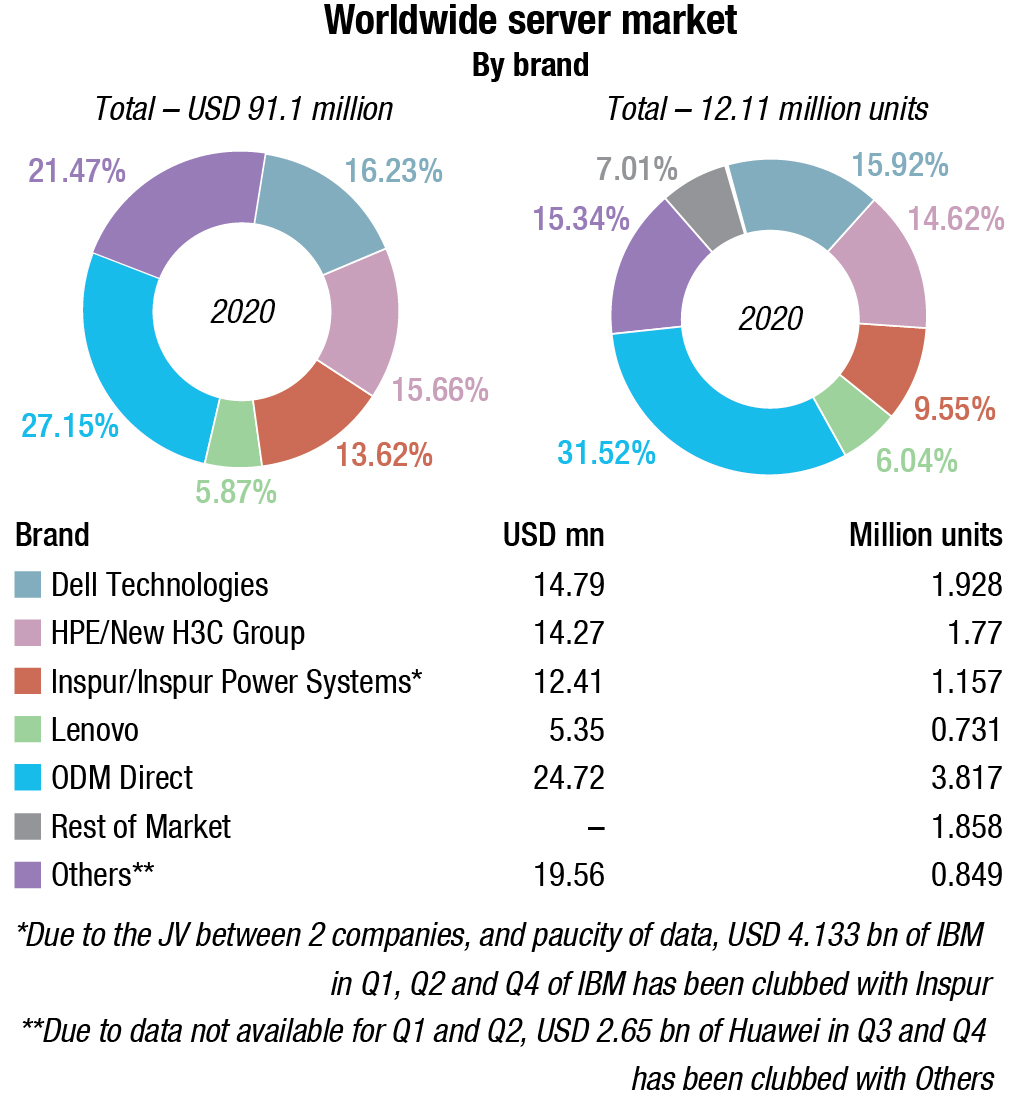
Vendor revenue in the worldwide server market is estimated at USD 91.1 billion in 2020, almost similar to USD 91.7 billion in 2019. Worldwide server shipments in 2020 are estimated at 12.11 million units. Revenue generated from x86 servers is estimated at USD 82.5 million and non-x86 server revenue as USD 8.6 million.
The vendor revenue generated from volume servers is estimated at USD 73.33 million, mid-range servers as USD 11.82 million and high-end servers as USD 5.95 million.
HPE/New H3C Group and Dell Technologies in 2020 were tied for the top position in the worldwide server market, and had a combined share of 31.9 percent for 2020. Inspur/Inspur Power Systems finished third, while Lenovo held the fourth position. Due to the joint venture between the two companies, and paucity of data, USD 4.133 bn in Q1, Q2 and Q4 of IBM has been clubbed with Inspur. Due to data not available for Q1 and Q2, USD 2.65 bn of Huawei in Q3 and Q4 has been included in the Others category.
Worldwide external OEM storage systems market
The global market revenue for enterprise external OEM storage systems is estimated at USD 27.36 billion, a decline of 4 percent over 2019. Total external OEM storage capacity shipped was 77.1 exabytes during the year. Geographically, the lone region to experience growth was China (PRC). The ODM Direct segment saw some traction.
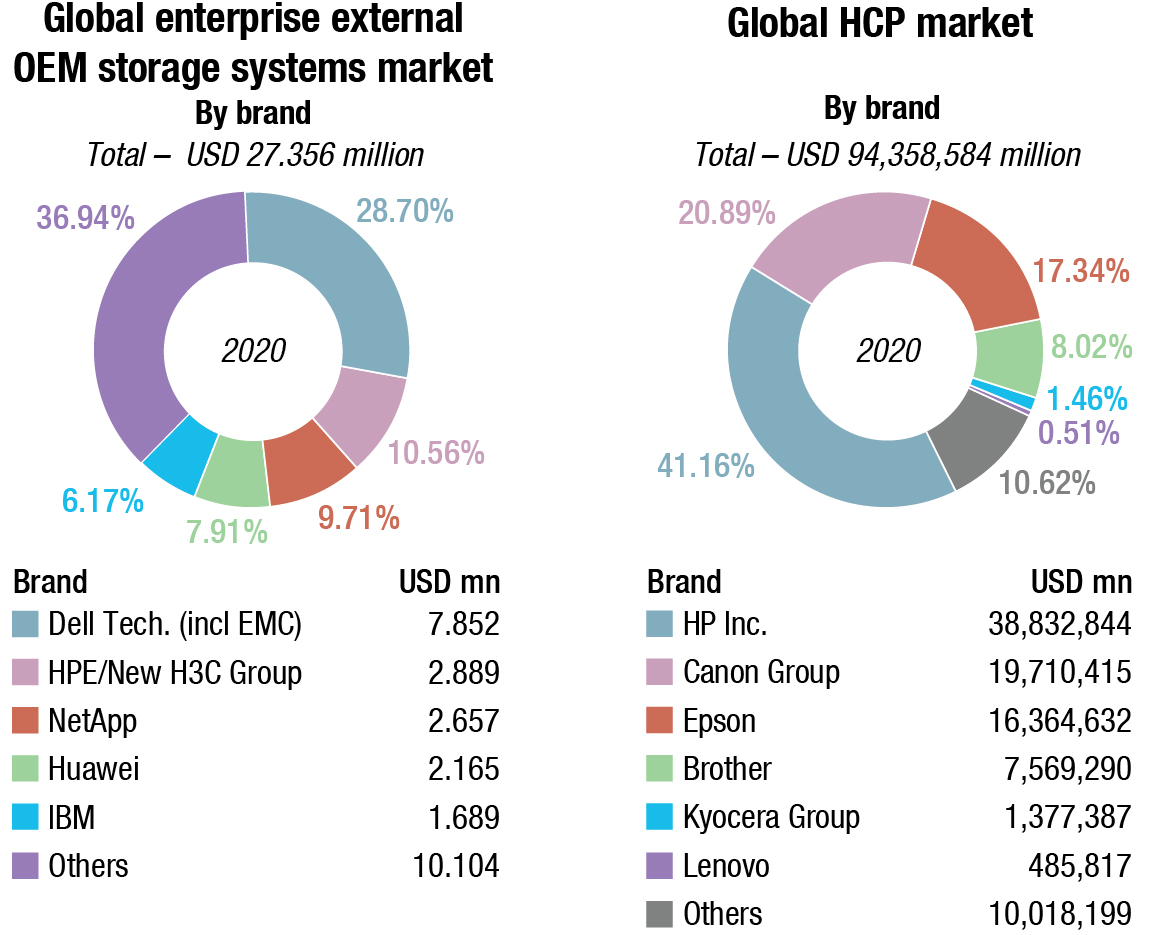
Dell Technologies (including EMC) was the largest external enterprise storage systems supplier during the year, followed by HPE/New H3C Group, NetApp. Huawei, and IBM took the third, fourth, and fifth positions in the market, respectively. Hitachi and Pure Storage are also aggressive in this segment.
Enterprise storage system is defined as a set of storage elements, including controllers, cables, and (in some instances) host bus adapters, associated with three or more disks. A system may be located outside of or within a server cabinet and the average cost of the disk storage systems does not include infrastructure storage hardware (i.e. switches) and non-bundled storage software.
HCP market
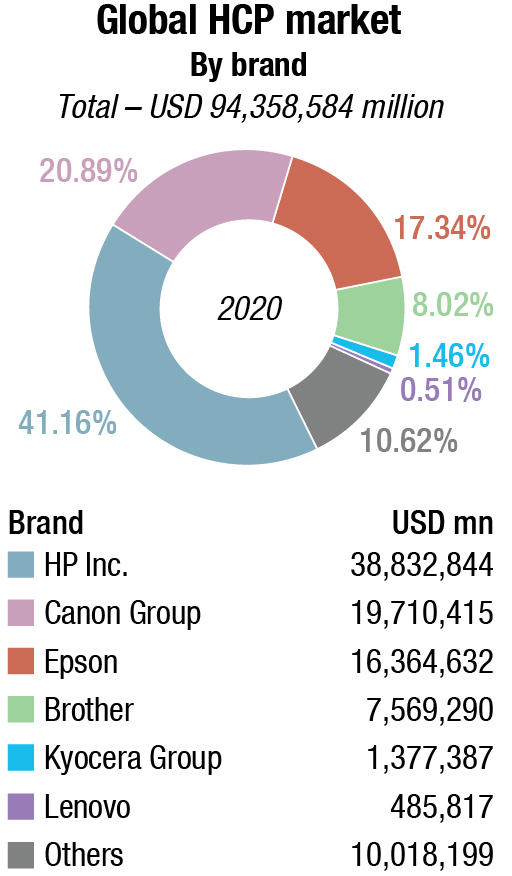
The worldwide hardcopy peripherals (HCP) market at 94.36 million units saw a 0.4 percent overall unit growth for the full year 2020. Strong shipment growth in the second half of the year was largely responsible for this. Value declined 12.3 percent for the whole year, however, due to low shipments of high-end office devices, the low-end consumer inkjets and monochrome laser devices, which were readily available toward the end of the year at competitive prices. China was the largest market.
HP Inc. outperformed all other companies in the top 6 in terms of shipment growth, with worldwide shipments of 38.83 million units in the year. Canon group closed second at 19.71 million units and Epson at 16.36 million units. Other aggressive brands are Brother, Lenovo and Kyocera.
 Brandon Butler
Senior Research Analyst
Network Infrastructure
IDC
“The enterprise WLAN market showed strength in the fourth quarter of 2020 and drove the full year 2020 results to just under 2 percent growth. Given the challenges faced by organizations due to the global COVID-19 pandemic, the WLAN market’s growth for the full year exemplifies how enterprises continue to prioritize wireless as a connectivity method.”
 Nabila Popal
Research Director
IDC
“There are a lot of elements at play that are fueling the smartphone market recovery – pent-up demand, continued supply push on 5G, aggressive promotions, and the popularity of low to mid-priced phones. Lockdowns also have people spending less on areas like leisure, travel, and dining out – and smartphones are benefitting from this. In addition to all these factors, the fast recovery and resilience of the smartphone supply chain also has to be given some credit.”
Smartphones market
The worldwide smartphone market continued to improve in the holiday quarter of 2020 (4Q20) returning to familiar ground with 4.3 percent year-over-year growth. The progress toward market recovery has been impressive and IDC believes the momentum heading into 2021 will remain strong.
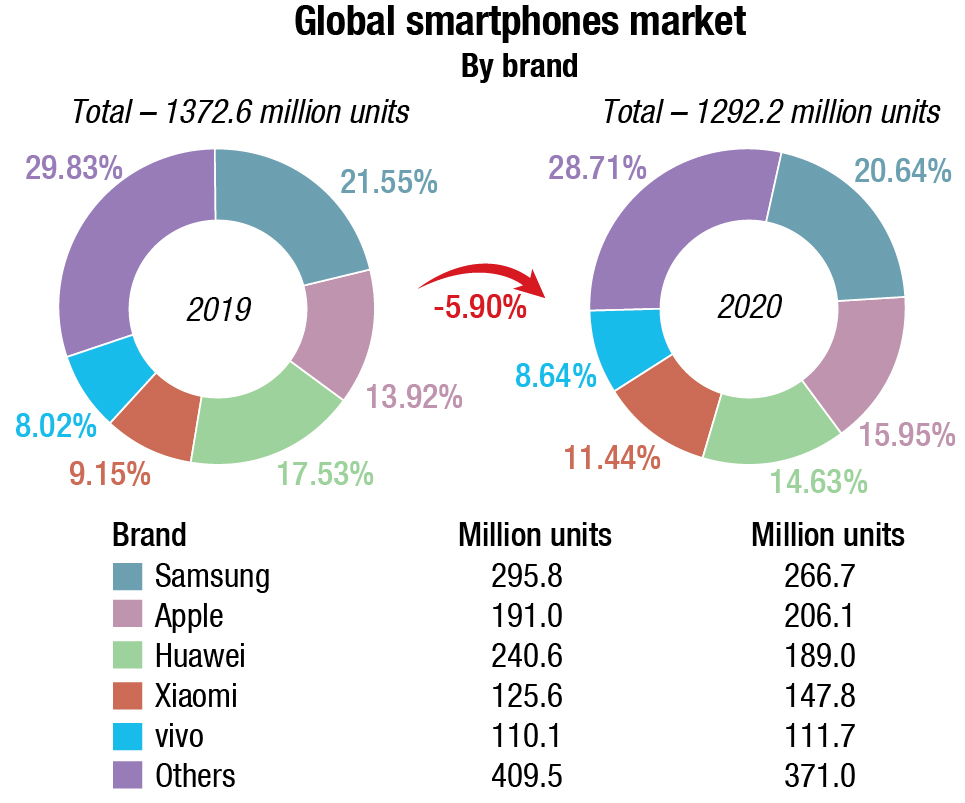
Smartphone vendors shipped a total of 1292.2 million devices during the year 2020, a decline of 5.9 percent compared to 2019.
In terms of vendors, there was a clear shift among the Top 5. Apple delivered a phenomenal performance in 4Q20, returning to the number 1 position with 90.1 million devices shipped, driven by the success of the iPhone 12 series. This represents the highest shipment volume from a vendor in a single quarter and resulted in 23.4 percent market share and 22.2 percent year-over-year growth. Samsung moved to number 2 with 73.9 million device shipments and 19.1 percent market share. With the continued success of the A series and growth in nearly every region, Samsung saw year-over-year growth of 6.2 percent. Xiaomi finished the quarter in the third position with shipments of 43.3 million and 11.2 percent market share while OPPO was fourth with shipments of 33.8 million and 8.8 percent market share. Both companies successfully capitalized on declining Huawei shipments, growing 32 percent and 10.7 percent year over year respectively, by focusing on aggressive product portfolios and building partnerships. Huawei fell to the number 5 spot with shipments of 32.3 million and 8.4 percent market share. The company continues to suffer under the weight of US sanctions and saw a dramatic year-over-year decline of 42.4 percent.
Smartphone shipments are forecast to grow 13.9 percent on year in the first quarter of 2021 and 5.5 percent for the full year 2021, driven by continued recovery in demand and a supply-side push of 5G devices. IDC expects the global smartphone market to deliver a compound annual growth rate (CAGR) of 3.6 percent from 2020 to 2025.
Everyone in the value chain – from supply chains, OEMs, and channels to consumers – is better prepared to handle any further lockdowns. There has been accelerated growth in online channels, climbing to 27 percent share in 2020 from just 20 percent the prior year, as channels adapt to the pandemic lifestyle. Ramp ups in production and improved channel planning combined with strong pent-up demand are all pointing to healthy growth in the months ahead.
China and the US, the two largest geographic markets are forecast to grow by 5 percent and 3.5 percent, respectively in 2021. The outlook for China remained stable despite several city-level lockdowns in January 2021, reflecting the strength of consumer confidence there. Despite a 10-11 percent year-over-year decline for both markets in 2020 amidst the pandemic, 5G development and the success of the recently launched iPhones are expected to boost shipments in 2021.
5G remains the driving factor in the industry, accelerated further by the success of Apple’s full 5G iPhone 12 lineup. IDC expects 5G smartphone shipments to account for more than 40 percent of global volumes in 2021 and grow to 69 percent in 2025.
Both factors have helped increase the overall ASP for smartphones to USD 363 in 2021, up from USD 349 in IDC’s previous forecast. In regards to 5G ASP specifically, increasing competition in the 5G Android space, particularly from Chinese vendors, will bring downward pressure on 5G ASPs, which are expected to drop to USD 404 by the end of the forecast period in 2025.
Used smartphones
The worldwide shipments of used smartphones, inclusive of both officially refurbished and used smartphones, are expected to reach a total of 225.4 million units in 2020, with USA expecting to corner 55 percent of the market. This represents an increase of 9.2 percent over the 206.5 million units shipped in 2019. The used smartphone shipments are projected to reach 351.6 million units, valued at USD 65 billion in 2024, with a compound annual growth rate (CAGR) of 11.2 percent from 2019 to 2024.
Much of the 9.2 percent growth continues to be driven by mature markets in which trade-in emulates a form of subsidy to push consumers to upgrade. Over the past year, we have seen rapid growth in trade-in programs and ASPs across numerous channels. Premium flagship offerings continue to rely heavily on trade-in programs to make the upfront cost more affordable to consumers. Vendors such as Apple, Samsung, and Huawei have all implemented their own programs with very aggressive trade-in offers compared with other channels. Telcos on the other hand are using trade-in combined with bundling (family plans and services) to get consumers to turn over their old device and upgrade. Although 2020 volume was not as large as expected, the used market still performed well compared with the new market, where IDC is expecting a 6.4 percent decline for smartphones for the year. The research company expects to see double-digit growth, 2020-2024 at an average of 11.8 percent.
A refurbished smartphone is defined as a device that has been used and disposed of at a collection point by its owner. Once the device has been examined and classified as suitable for refurbishment, it is sent off to a facility for reconditioning and is eventually sold via a secondary market channel.
INDIAN MARKET
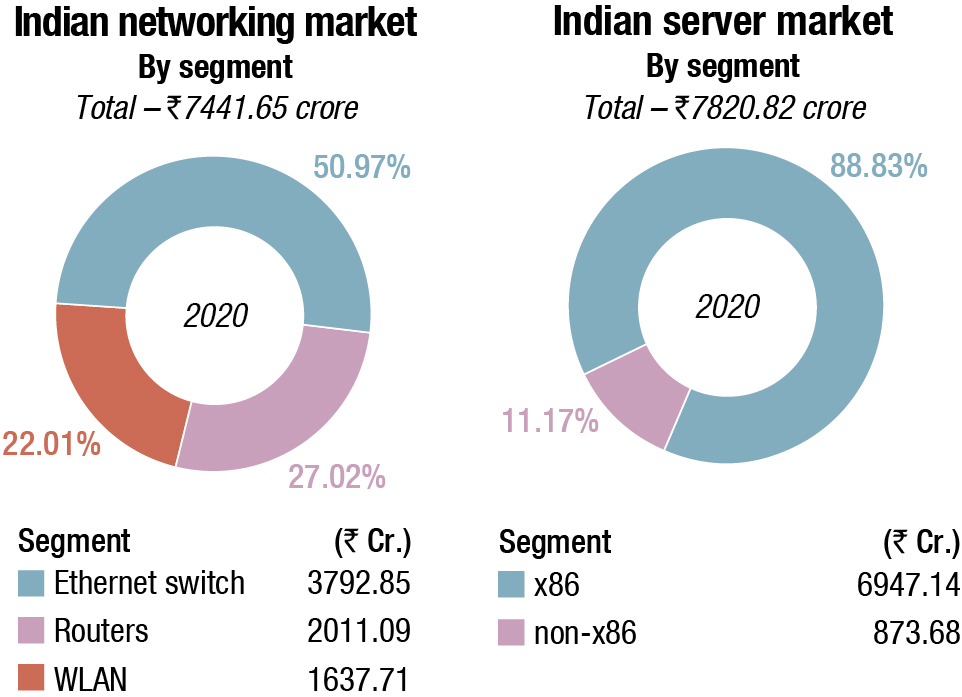
The Indian networking market in 2020 is estimated at ₹7441.65 crore, a 14.65 percent decline from ₹8719.2 crore in 2019. While the market share of ethernet switches remained in the vicinity of 50 percent, routers declined from 32 percent in 2019 to 27 percent in 2020, and WLAN gained, increasing share from 18 percent in 2019 to 22 percent in 2020.
The decline in the networking market was majorly characterized by the fall in router revenues. The routing business in 2020 in India declined by 28.2 percent. Demand for consumer grade gateway routers saw a rapid increase driven by remote working and online schooling. However, the enterprise class WLAN (access points and controllers) segment declined significantly due to lesser demand for campus infrastructure.
Market for Wi-Fi 6 witnessed significant traction in the Indian market. While the revenue contribution of Wi-Fi 6 differed by vendors, there was a significant jump in the sales of Wi-Fi 6 access points across all the major vendors in the segment.
Much like the routing segment, the decline in the ethernet switch segment was attributed to the decline in investments from service providers. While the switch market declined from a sequential standpoint, the switch market expanded in Q3 and Q4, which shows that the market is recovering from the COVID-19 impact. Key segments like professional services and banking continued to spend. However, investments from other verticals continued to be slow.
Ethernet switch market
The Ethernet switch market in 2020 India stood at ₹3792.85 crore (by vendor revenue) registering a YoY decline of 11.29 percent.
Both DC and Non-DC segments posted a YoY decline. Professional services, telecom and banking were some of the key business verticals. Banking played a very important role in providing continuous investments during the COVID-19 period. The consolidation exercise within the banking sector had greatly boosted the revenues of ethernet switching segments. Investments from manufacturing also showed some signs of recovery from 3Q in terms of specific segments such as hi-tech, automotive, and pharma manufacturing. A sudden drop in campus switch requirements, especially in 2Q reduced spending across major industry verticals. Supply chain issues were also aggravated due to the complete lockdown that happened, especially in most part of the second quarter. Government buying continued to be slow specifically in the state government segment. IDC expects the market to fully recover by 1H 2021 subject to the pandemic’s prognosis in the country.
Cisco continued to dominate the Ethernet switch market, followed by Huawei and HPE.
 Will Stofega
Program Director
Mobile Phones, IDC
“Although the COVID-19 pandemic has posed challenges for secondary market participants around able-bodied workers and logistics, most of the industry has been able to satisfy demand for refurbished smartphones. Once the pandemic begins to fade, those that were able to invest in technology will be well-poised to prosper during the recovery.”
Ethernet router market
The India router market in 2020 stood at ₹2011.09 crore (by vendor revenue) with a decline of 28.2 percent over 2019 due to the decline in investments from the service provider segment. Banking contributed to the majority of the business in the enterprise segment with SD-WAN adoption being one of the key growth drivers. Spending from segments like government and manufacturing remained stagnant. Recovery for the routing segment is expected to happen in the first half of 2021.
Cisco leads the router market, followed by Juniper and Nokia.
Ethernet WLAN market
The Indian WLAN market in 2020 market stood at ₹1637.71 crore (by vendor revenue) majorly contributed by consumer gateway routers. While enterprise class WLAN took a significant decline, the consumer gateway router demand picked rapidly to support the growing demand of employees and students working out of their homes.
Lower demand for campus infrastructure caused a steep decline in the enterprise WLAN segment (access points and controllers). Despite the lower demand in the enterprise WLAN segment, Wi-Fi 6 is picking up traction in India with a significant jump in revenues over the last few quarters.
Public hotspot initiative projects, such as PM WANI is expected to boost the growth of wireless infrastructure business in the country thereby enabling an effective last mile to fuel growth in the tier-2 and tier-3 cities of India.
TP-Link was the market leader, followed by D-Link due to the rapid increase in demand for consumer gateway routers. The enterprise class WLAN segment was led by Cisco followed by Hewlett Packard Enterprise.
COVID-19 has accelerated the enterprise movement toward cloud which has become the origin of transformation in the networking ecosystem. Many of the networking investments have been around technologies that enable seamless working from anywhere, enhancing the security framework, extending the corporate network efficiently, easier manageability and troubleshooting, and bringing back employees into the office premises safely. The focus for software-driven has been more than ever, the market is also at the point where networking and security cannot be perceived as silos anymore. In short, COVID-19 has accelerated the pace of network transformation which will transform to self-healing/self-driving networks of tomorrow.
The Ethernet switch, router, and WLAN markets are expected to grow in single digits in terms of compound annual growth rate (CAGR) for 2018–2023. Increased adoption of emerging technologies such as cloud, IoT, mobility, etc. would drive incremental revenues. Large investments for 5G rollouts are also expected in the next couple of years.
 Ashutosh Bisht
Senior Research Manager
IDC
“Various initiatives by Indian government such as recent production led incentives (PLI), infrastructure modernization to remove bottlenecks in the supply chain, Atmanirbhar Bharat, Make in India and others to make enterprises competitive. To achieve this, technology-led investment towards digital transformation is inevitable. Providing an alternate to China as the global manufacturing hub will also step-up India’s position in the global arena.
Server market
The overall server market in India in 2020 is estimated ₹7820.82 crore.
The x86 server market contribution grew to 88.8 percent in terms of revenue. The highest contribution in the x86 market mainly came from the professional services, telecommunications, and manufacturing verticals. In the professional services vertical, original design manufacturers (ODM) and new-age IT companies witnessed positive YoY growth with respect to the server spend.
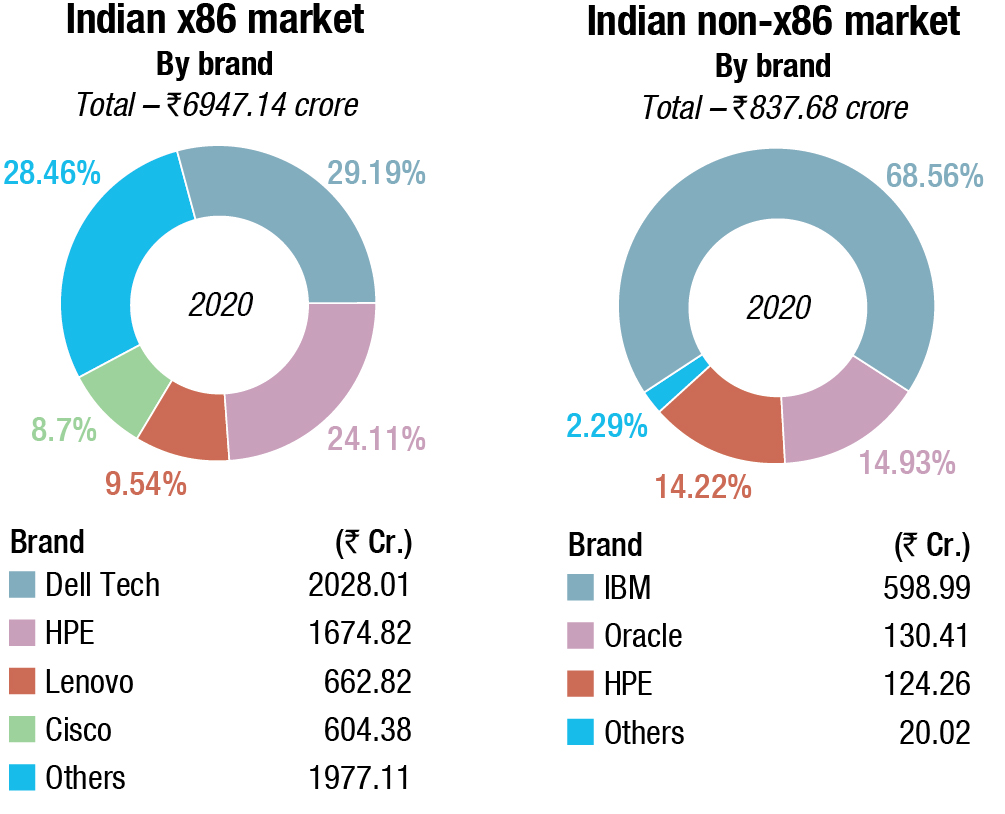
The x86 server market in terms of revenue declined to reach ₹6947.14 crore 2020. The contribution largely came from the custom-built server category. Hyperscalers continue to spend toward building robust data centers and support the global and local customer demands. The general-purpose server revenue declined due to the weakening demand across different industries. During 2020, verticals such as utilities, resource industries, and securities and investment services witnessed the highest growth in terms of revenue.
The non-x86 server market declined to reach ₹837.68 crore in revenue in 2020. IBM continues to dominate the market accounting for 68.56 percent of revenue share, during 2020 with a revenue of ₹598.99 crore. HPE came at second position followed by Oracle with a revenue share of 14.93 percent and 14.22 percent respectively.
Company highlights
In 2020, Dell Technologies emerged as the top vendor in the India x86 server market with a revenue share of 29.19 percent and a revenue of ₹2028.01 crore. Top three verticals for Dell Technologies were professional services, banking, and discrete manufacturing. HPE came at second spot with a revenue share of 24.11 percent and a revenue of ₹1674.82 crore. Key verticals for HPE were telecommunications, discrete manufacturing, and professional services. At number three is Lenovo with a revenue share of 9.54 percent and a revenue of ₹662.82 crore. Cisco came in fourth accounting for a revenue share of 8.7 percent and a revenue of ₹604.38 crore.
India’s economy is on the verge of gaining momentum post COVID-19 lockdown and roll out of coronavirus vaccines. From an enterprise spending perspective, we anticipate investments in compute to come from global hyperscalers and local DC players, telecommunications vertical, banking sector, and manufacturing vertical. Telecommunications spending would be focused on network modernization, VAS services, and preparing for 5G roll out.
India’s external storage market
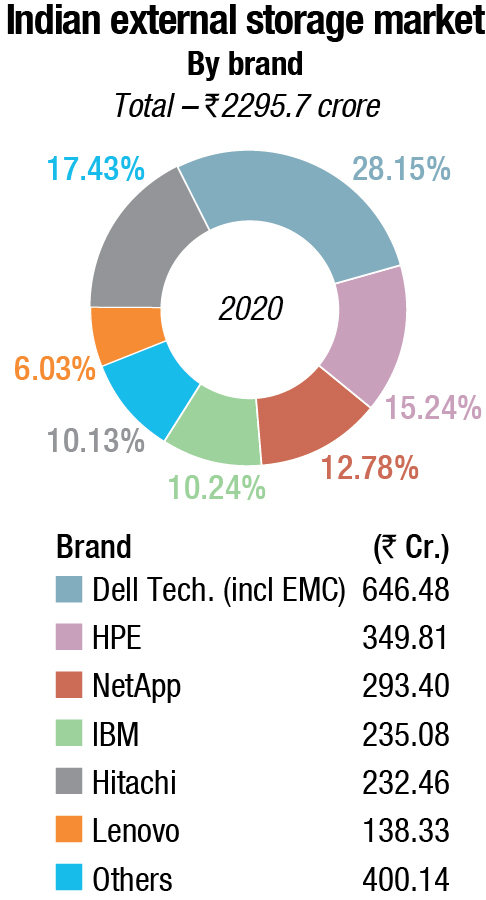
India’s external storage market witnessed a decline by vendor revenue and stood at ₹2295.7 crore in 2020. The majority of the decline in storage spending was due to decreased spending from banking organizations, while manufacturing, central government and security, and investment services saw a growth in 2020. The full year decline for the external storage market in India during 2020 (Jan-Dec) was 21.8 percent.
The growth of All-Flash Arrays (AFA) is evident across verticals. BFSI, professional services, manufacturing, and government verticals were the major contributors to AFA demand. Stronger uptake of NVMe-based flash arrays is witnessed due to significant performance benefits with negligible cost differences. In the coming years, enterprises would prefer NVMe-based flash arrays as de facto storage media for all the production workloads.
All the Storage Class segments saw a sharp decline in Q4 2020. Entry storage and high-end storage segments witnessed a strong YoY decline compared to midrange systems The impact of Entry storage is due to decreased storage demand from SMB and enterprises for their non-core applications.
Enterprises are investing in the modernization of applications/Infrastructure, seamless movement of data across multiple clouds, AIOps for managing infrastructure platforms, and security to be digitally resilient. Organizations are looking for trusted advisors and not standalone technology deployment partners to enable them to be future-ready.
Dell Technologies continued to be the market leader in the external storage systems market with a 28.15 percent market share by vendor revenue, followed by HPE with a 15.2 percent market share in 2020.
The external storage systems market is expected to grow at a single-digit compounded annual growth rate (CAGR) for the 2020-2025 period. External storage systems spending is expected to recover and significantly grow YoY in CY 2021.
ICT spend to rise 10 percent to USD 91 billion in 2021
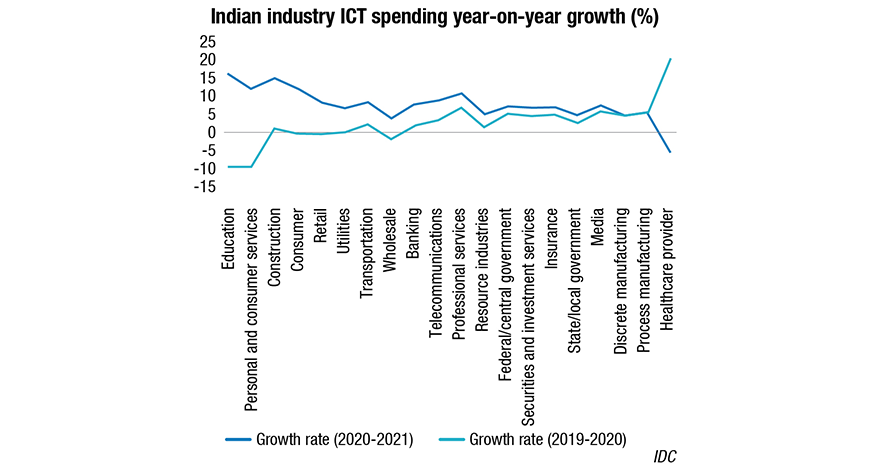
Enterprises’ focus during the current pandemic to ensure future growth, innovation, and resilience is helping to revive Indian ICT spend to a strong positive outlook in 2021. India’s ICT spending is expected to grow by over 10 percent to reach USD 91 billion in 2021 and expected to reach USD 111 billion by 2024.
The revival of economic activities across India together with growing consumer demand played a key role in expediting this growth. The accelerated push toward going digital was due to a change in focus of enterprises, be it their business model, or to create digital products and services and deliver digital-first experience. Major industries have reached operations at optimal levels as demand picked up owing to an improved supply throughout the end of last year and into 2021.
With respect to industry verticals, Education is expected to show the highest bounce back in 2021 owing to a continued focus on a hybrid operating model. Private schools and professional certification courses are changing the methods of learning due to the pandemic as demand for specialized skills is on the rise. This is supported by the adoption of e-Learning solutions and e-Certifications provided by many organizations and institutions. Personal and Consumer Services has been at the forefront as lockdown started to lift by end of 2020. Changing the way for a consumer to avail services has quickly created more opportunities for spending on technology since new rules and regulations make it important to avoid a rise in infection rates.
The banking and telecommunications industry contributes the highest, around 14 percent of the overall ICT spend in 2021. The banking sector is expected to grow at 7.8 percent in 2021 and is mainly driven by increased ICT investments in redesigned customer experience (CX), business continuity, and cybersecurity. Spend in the telecommunication industry is expected to grow at 9.1 percent in 2021 as India continues to be a hub for innovation and operators, even though cost-constrained, will focus on bringing in cost transformations in operations.
 Harshal Udatewar
Market Analyst, Server
IDC India
“During 2020, the server market failed to recover as it remained impacted due to the pandemic. For 2021, we expect the server market demand to grow across hyperscalers, local data center players, telecommunication companies, banking and financial institutions, and manufacturing firms. Government pipeline looks promising and can expect spend in H2 2021.”
Very Large Business (1000+ employees) continues to hold the largest market throughout the forecast. It contributes to almost half of the ICT Spending excluding the consumer segment, as it’s easier for large businesses to re-allocate budgets from planned activities to crisis response-related IT projects for stable operations. SMB segment will be focusing on remote training, secure connectivity, and virtual workspaces as their top priority will be to attain resiliency of operations. However, investments in customer engagements (self-servicing, online engagements) and new digital offerings for both products and services are expected to be the outlook for all company sizes post-2020.
 Ryan Reith
Program Vice President
IDC’s Worldwide Mobile Device Trackers
“The recovery of both the smartphone market and its supply chain has been truly impressive and the year-end growth is testament to how far we’ve come. The majority of the world is either in some form of lockdown or still waiting to return to normal day-to-day life, yet smartphone sales are rebounding as though nothing ever happened. This illustrates the importance of smartphones in everyone’s life and provides a strong foundation for market demand. As the world progresses towards a post-pandemic environment, IDC believes demand will grow and the market recovery will accelerate.”
HCP market
The Indian Hardcopy Peripherals (HCP) market was largely driven by ink tank printers. The HCP market recorded its best Q4 till date in terms of unit shipments. As the country opened further during the festival season and vendors partially resolved their supply issues following a global surge in demand, India’s HCP market witnessed a growth of 4 percent quarter-over-quarter (QoQ) during 4Q20 (Oct-Dec 2020). The market registered shipments of 0.95 million units during the quarter posting a growth of 19.7 percent year-over-year.
In the inkjet segment, vendors continued to face supply challenges during the beginning of the quarter. However, the situation improved as the manufacturing hubs in China and Southeast Asian countries increased their capacity to meet the global surge in demand for inkjet printers from the home segment. Following this, the inkjet segment noted a YoY growth of 38.8 percent. Within inkjet printers, the ink tank printer segment grew steadily following improved availability and the pent-up consumer demand owing to continued work from home and e-learning for students.
The laser printers’ segment (including copiers) recorded a YoY growth of 3.8 percent at the back of laser printers (excluding copiers) as multiple delayed orders from the previous few quarters were executed in 4Q20. The laser copier segment, however, witnessed a YoY decline of 27.5 percent following muted demand from corporates.
For the CY2020, the overall HCP market at 2.86 million units declined by 19.1 percent mainly due to the laser segment (including copiers) which declined by 28.5 percent, following the commercial market’s struggle to resume operations during the COVID-19 crisis. The laser copier market dropped by 44.9 percent owing to weak corporate and government demand. The inkjet market declined by 9.2 percent, due to the surge in demand from the home segment. CY2020 observed high demand for Wi-Fi and ink tank printers which could be met partially as vendors struggled to furnish enough stock. Vendors were challenged by the limited manufacturing capacity following the global surge in demand for Wi-Fi ink tank printers.
Company highlights
HP Inc. (excluding Samsung) maintained its leadership in the overall HCP market with a share of 38.11 percent. Its growth was primarily led by the inkjet segment, as it smoothened its supply and logistics issues to cater to the increased demand. HP recorded an almost equal growth in both the segments – ink tank and ink cartridge-based printers.
Epson replaced Canon to occupy the second position in the overall HCP market with a market share of 26.5 percent in 2020. In the inkjet segment, Epson replaced HP to regain its top position in the market with a share of 41.1 percent in 4Q20. This comes primarily at the back of Epson having resolved the supply issues it was facing previously in 3Q20.
Canon occupied the third position in the overall India HCP market, capturing a unit market share of 22.97 percent in 2020. And in 4Q20, in the inkjet segment, Canon observed a YoY growth of 63.9 percent at the back of its increased online presence and lucrative end-user schemes. In the laser segment (including laser copiers) Canon maintained its second position with a market share of 25.0 percent with a heavy dependency on entry-level mono printers, primarily LBP 2900B. In the laser copier segment, although Canon declined by 33.3 percent YoY, yet it continued to lead the copier market with a 32.6 percent market share because of its wide product portfolio and a strong foothold in the corporate segment.
Smartphones market
After several years of growth, India’s smartphone market declined in 2020. The market exited 2020 at 149.7 million units, a 2 percent YoY decline, after several years of growth. Stay-at-home mandates, remote work, remote education, travel restrictions, and manufacturing shutdowns led to a sluggish H1’20 (-26 percent YoY decline), particularly impacting 2Q20.
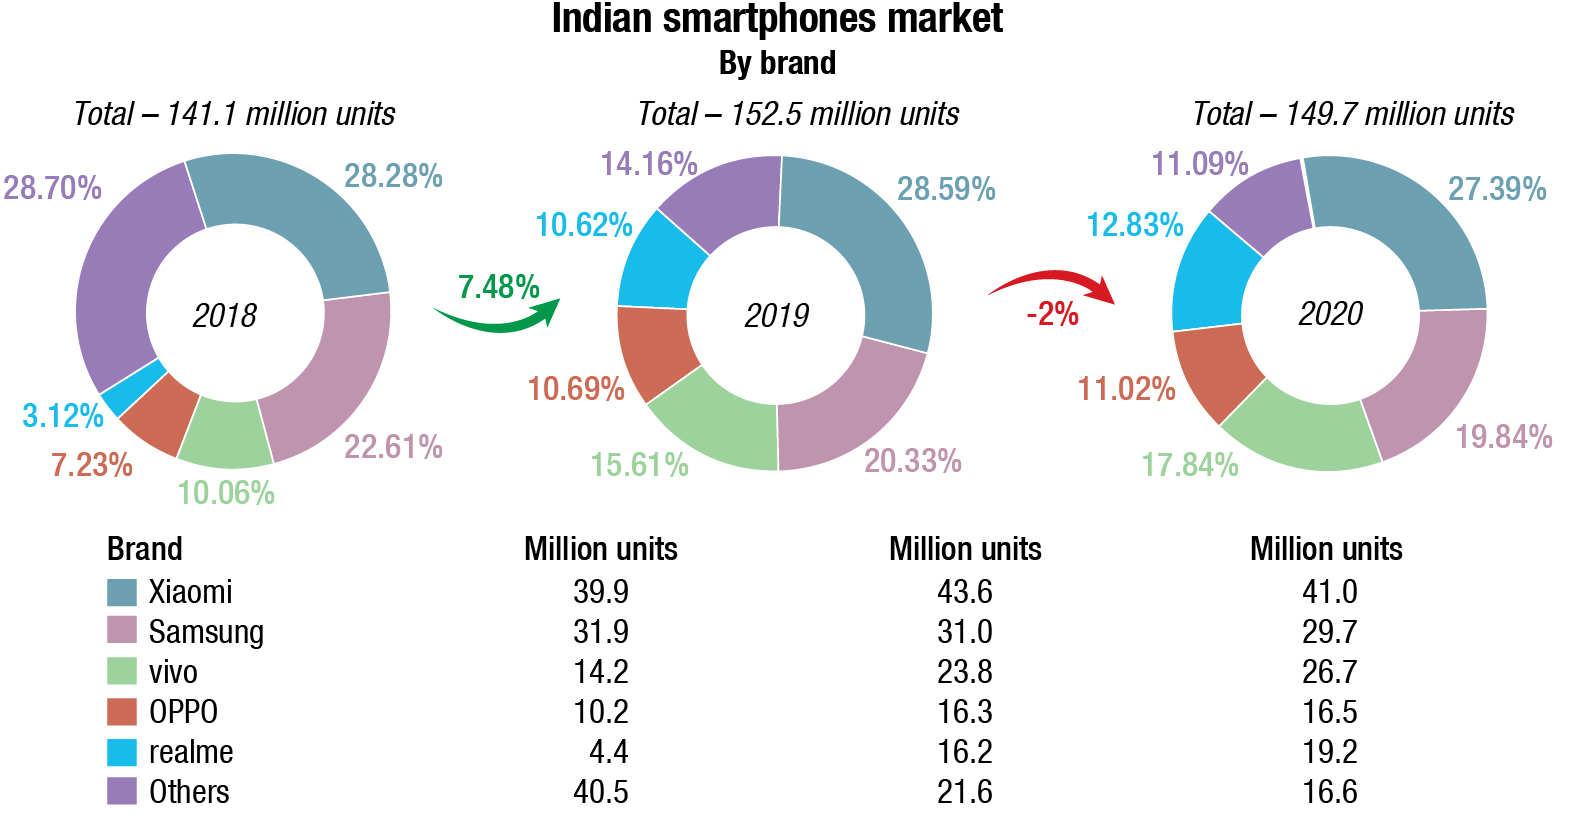
However, H2’20 recovered, with 19 percent YoY growth, as markets reopened gradually. Lockdowns and restrictions rendered an urgent need for devices supporting activities such as entertainment, work from home, and remote learning, resulting in more devices per household, and leading to a resurgence in demand for consumer devices including smartphones, consumer notebooks, and tablets in 2020.
4Q20 (October-December) posted record fourth-quarter smartphone shipments of 45 million devices, with 21 percent YoY growth. While smartphone shipments for the full year 2020 remained below the pre-pandemic level, IDC believes a stronger market acceleration in 2021 will be led by upgraders.
The key market trends for 2020 are may be summarised as:
The online channel outpaced the overall market, growing by 12 percent annually with a 48 percent market share in 2020. Multiple sales events, promotions, trade-in/upgrade programs, and affordability initiatives helped it in clocking a record 51 percent share in 4Q20. However, in the pre-Diwali weeks of October and November, retail footfall gradually picked up the pace, as the offline channel registered 5 percent YoY growth in 4Q20.
MediaTek processor-based smartphone shipments led with a share of 43 percent, closely followed by Qualcomm at 40 percent in 2020. MediaTek expanded its lead in the <USD 200 price segments.
5G smartphone shipments crossed 3 million in 2020, with Chinese OEMs rolling out aggressively-priced devices through 2020, including Xiaomi’s Mi 10i at a <USD 250 price point. But adoption was limited by higher prices and the lack of a 5G network, which is expected to start to roll out in late 2021 or early 2022.
“As more 5G devices enter in 2021, the ASP for smartphones is expected to rise. IDC expects vendors to launch 5G devices at multiple price points backed by aggressive promotions, as 5G currently remains a novelty rather than a necessity to most,” says Upasana Joshi, Associate Research Manager, Client Devices, IDC India.
 Nishant Bansal
Senior Research Manager
IPDS, IDC India
“Consumer demand is expected to remain robust for 1H21 while enterprise demand is expected to resume in a phased manner as employees return to office. Additionally, government demand is also expected to pick up in 1Q21 as ministries and public sector enterprises exhaust their CAPEX quota, as the financial year ends. However, the supply challenges are expected to continue for the first half of the year, which can impact the demand fulfilment to some extent.”
Top 5 smartphone vendor highlights
Xiaomi’s performance in 2020 was led by its affordable Redmi 8 series, gradually replaced by the Redmi 9 series in H2’20. Though it continued to face supply shortages through H2’20, resulting in an annual decline, Xiaomi maintained its leadership in 2020. POCO, Xiaomi’s sub-brand, entered the “top 5 online channel vendor list”, strengthening Xiaomi’s online position at 39 percent share in 2020.
Samsung remained in its second spot in the 2020 ranking, with its online-heavy portfolio driven by the Galaxy M series and the newly launched F series. Online channel registered strong 65 percent YoY growth, while the offline channel shipments declined by 28 percent, thus leading to an overall drop of 4 percent in 2020.
Vivo stood at the third position, with strong growth in the offline channel, dethroning Samsung for the leadership position in the offline channel with 30 percent share, driven by the affordable Y series and dedicated efforts in marketing and promotional activities in offline channels.
realme surpassed OPPO for the fourth slot with 19 million annual shipments, growing by 19 percent YoY in 2020. It continued to be the second-largest online vendor, with its affordable C-series as a major driver.
OPPO’s annual growth remained flat YoY in 2020, while it maintained a focus on the offline channels, and regained its third slot ahead of Xiaomi with an 18 percent annual share driven by the affordable A series.
Others. Transsion (ranked sixth) accounted for an impressive 64 percent annual growth in 2020, driven by its online-exclusive Infinix portfolio and its Itel and Tecno-branded phones widely available in smaller towns and rural areas. Apple, at the seventh slot, exited 2020 with YoY growth of 93 percent, driven by previous generation products like the iPhone 11, iPhone SE (2020), and iPhone XR, even as the new iPhone 12 series had a strong pickup in 4Q20.
 Mario Allen
Senior Market Analyst for IT Spending Group APeJC
IDC
“A digital transformation is on the horizon for all industries across India. This has changed how traditionally hardware has been purchased, services that are opted for, and software developed to help in everyday activity across all industries. The interaction between these three will supplement each other to reinforce future growth.”
Public cloud services market
The India public cloud services (PCS) market, including infrastructure-as-a-service (IaaS), platform-as-a-service (PaaS) solutions, and software-as-a-service (SaaS), touched USD 1.6 billion for the first half of 2020. The overall India public cloud services market is likely to touch USD 7.4 billion by 2024 growing at a CAGR of 22.2 percent for 2020-24.
The spending continues to solidify with the top two cloud providers capturing close to 52 percent of the Indian public cloud services market in the 1H 2020. From a segment perspective, SaaS forms the largest component of the overall public cloud services market with over 63 percent of the overall market in 1H2020, followed by IaaS and PaaS segment.
The public cloud services market has nearly tripled since 2016. As businesses focus on gaining agility, flexibility, and resilience, reliance on cloud platforms and infrastructure as well as software as a service will become pivotal. Although most organizations in India have adopted cloud in some stage, the current pandemic situation has now enabled organizations to rely on public cloud IaaS and PaaS to expedite the development process and deployment of business applications.
2021 is expected to be a dynamic year, a year when enterprises are looking to prepare for a new normal in their enterprise network. Networks must support a significant increase in high-bandwidth, latency-sensitive applications and rely on advanced digital management platforms. This trend will drive investments in the networking market in 2021 and beyond.
The article is based on IDC research conducted over 2020.


You must be logged in to post a comment Login