
International Circuit
AT&T beats WS projections in Q1 with strong wireless subscriber growth
AT&T Inc. reported first-quarter results that highlighted consistent 5G and fiber customer additions and showcased profitable growth driven by increased Mobility service and broadband revenues.
First-Quarter Consolidated Results
- Revenues of $30.0 billion
- Diluted EPS of $0.47; adjusted EPS* of $0.55
- Operating income of $5.8 billion; adjusted operating income* of $6.0 billion
- Net income of $3.8 billion; adjusted EBITDA* of $11.0 billion
- Cash from operating activities of $7.5 billion, up $0.9 billion year over year
- Capital expenditures of $3.8 billion; capital investment* of $4.6 billion
- Free cash flow* of $3.1 billion, up $2.1 billion year over year
First-Quarter Highlights
- 349,000 postpaid phone net adds with an expected industry-leading postpaid phone churn of 0.72%
- Mobility service revenues of $16.0 billion, up 3.3% year over year
- 252,000 AT&T Fiber net adds; 17th consecutive quarter of 200,000+ net adds
- Consumer broadband revenues of $2.7 billion, up 7.7% year over year
- 27.1 million consumer and business locations passed with fiber
“Our results this quarter reflect continued strong growth in our Mobility and Consumer Wireline connectivity businesses, which represent about 80% of our total revenues,” said John Stankey, AT&T CEO. “Customers are choosing AT&T and staying with us. We achieved a record-low first-quarter postpaid phone churn, grew consumer broadband subscribers for the third consecutive quarter, and expanded margins in Mobility and Consumer Wireline. We’re also delivering on our commitment to grow and improve the quality and cadence of free cash flow, which increased by more than $2 billion year over year. This consistent, solid performance driven by our investment-led strategy gives us confidence to re-affirm our full-year consolidated financial guidance.”
2024 Outlook
For the full year, AT&T reiterates guidance of:
- Wireless service revenue growth in the 3% range.
- Broadband revenue growth of 7%+.
- Adjusted EBITDA* growth in the 3% range.
- Capital investment* in the $21-$22 billion range.
- Free cash flow* in the $17-$18 billion range.
- Adjusted EPS* in the $2.15-$2.25 range.
- In 2025, the company expects to deliver Adjusted EPS* growth.
Consolidated Financial Results
- Revenues for the first quarter totaled $30.0 billion versus $30.1 billion in the year-ago quarter, down 0.4%. This was due to declines in Mobility equipment revenues, driven mainly by lower sales volumes, and lower Business Wireline revenues. This was mostly offset by increased service revenues, driven by Mobility, Consumer Wireline, and Mexico. Revenue trends also include increases from favorable impacts of foreign exchange rates in Mexico.
- Operating expenses were $24.2 billion, essentially stable with $24.1 billion in the year-ago quarter. Operating expenses increased primarily due to higher depreciation related to our continued fiber and 5G investment, accelerated depreciation on wireless network equipment due to Open RAN transformation and associated restructuring charges. This was largely offset by lower Mobility equipment costs from lower sales volumes and benefits from continued transformation.
- Operating income was $5.8 billion versus $6.0 billion in the year-ago quarter. When adjusting for certain items, adjusted operating income* was $6.0 billion, essentially flat with the year-ago quarter.
Equity in net income of affiliates was $0.3 billion, primarily from the DIRECTV investment. With adjustment for our proportionate share of intangible amortization, adjusted equity in net income from the DIRECTV investment* was $0.6 billion. - Net income was $3.8 billion versus $4.5 billion in the year-ago quarter.
- Net income attributable to common stock was $3.4 billion versus $4.2 billion in the year-ago quarter. Earnings per diluted common share was $0.47 versus $0.57 in the year-ago quarter. Adjusting for $0.08, which includes restructuring and non-cash impairments, our proportionate share of intangible amortization from the DIRECTV equity method investment, and other items, adjusted earnings per diluted common share* was $0.55 compared to $0.60 in the year-ago quarter.
- Adjusted EBITDA was $11.0 billion versus $10.6 billion in the year-ago quarter.
- Cash from operating activities was $7.5 billion, up $0.9 billion year over year, due to operational growth and timing of working capital, including higher receivable sales, partially offset by higher mobile device payments.
- Capital expenditures were $3.8 billion in the quarter versus $4.3 billion in the year-ago quarter. Capital investment*, which includes $0.8 billion of cash payments for vendor financing, totaled $4.6 billion versus $6.4 billion in the year-ago quarter.
- Free cash flow* was $3.1 billion for the quarter versus $1.0 billion in the year-ago quarter.
- Total debt was $132.8 billion at the end of the first quarter, and net debt* was $128.7 billion. In the quarter, the company repaid $4.7 billion of long-term debt. The company continues to expect to achieve net debt-to-adjusted EBITDA* in the 2.5x range in the first half of 2025.
Segment and Business Unit Results
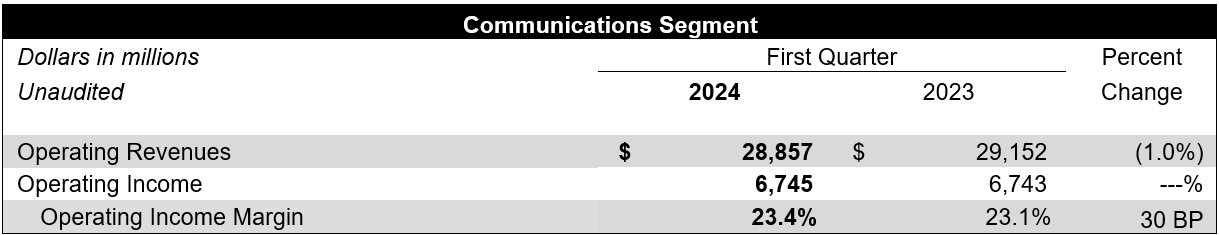
Communications segment revenues were $28.9 billion, down 1.0% year over year, with operating income essentially flat year over year.
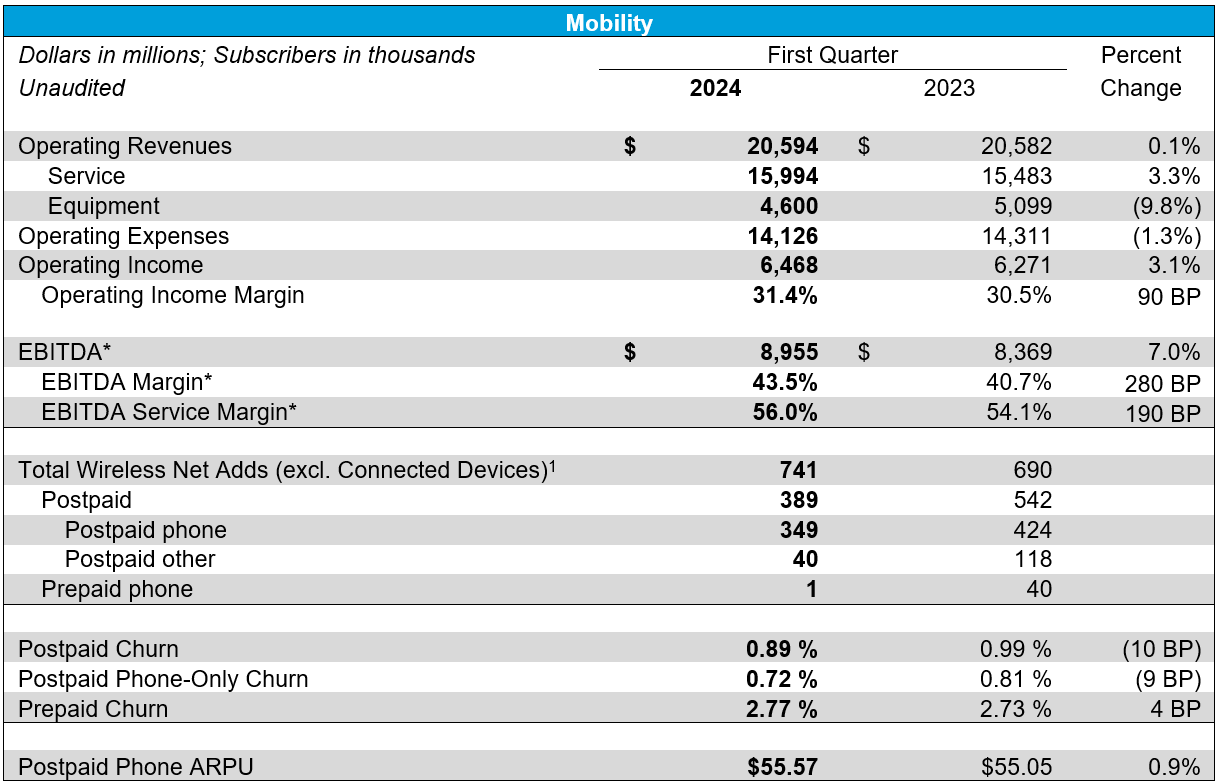
Mobility revenues were up 0.1% year over year, driven by service revenue growth of 3.3% from subscriber and postpaid ARPU growth, offset by lower equipment revenues due to lower sales volumes. Operating expenses were down 1.3% year over year due to lower equipment expenses resulting from lower device sales, partially offset by higher depreciation expense due to our Open RAN deployment and network transformation. Operating income was $6.5 billion, up 3.1% year over year. EBITDA* was $9.0 billion, up $586 million year over year, reflecting service revenue growth. This was the company’s highest first-quarter Mobility EBITDA.
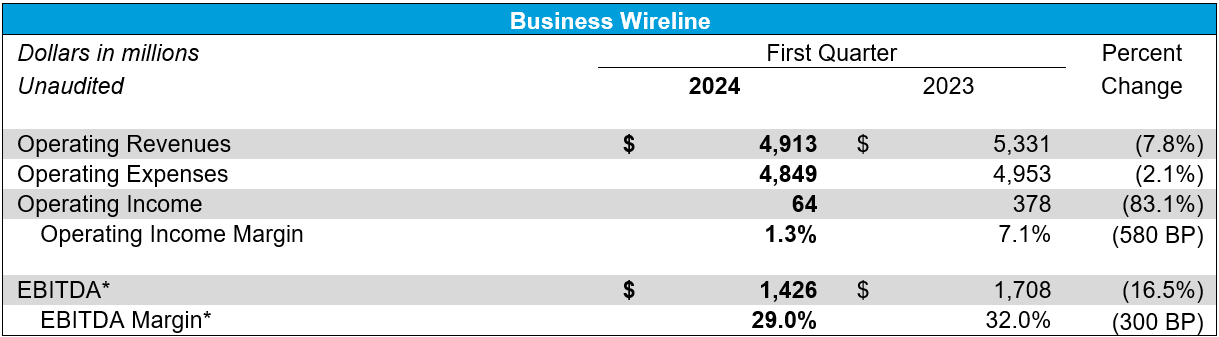
Business Wireline revenues were down 7.8% year over year, primarily due to lower demand for legacy voice and data services as well as product simplification, partially offset by growth in connectivity services, and non-recurring equipment revenues. Operating expenses were down 2.1% year over year, due to lower personnel costs, and lower marketing and customer support expenses, partially offset by higher equipment costs. Operating income was $64 million, down 83.1% year over year, and EBITDA* was $1.4 billion, down $282 million.
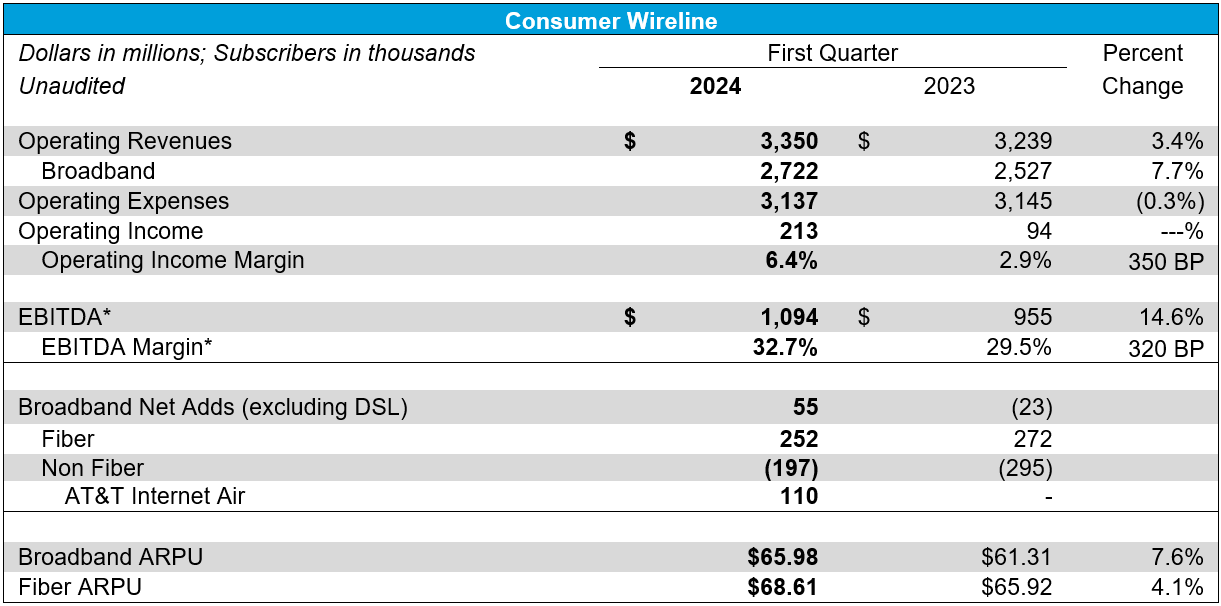
Consumer Wireline revenues were up 3.4% year over year, driven by growth in broadband revenues attributable to fiber revenues, which grew 19.5%, partially offset by declines in legacy voice and data services and other services. Operating expenses were down 0.3% year over year, largely driven by lower customer support costs that were offset by increased network-related costs and depreciation. Operating income was $213 million versus $94 million in the prior-year quarter, and EBITDA* was $1.1 billion, up $139 million year over year.
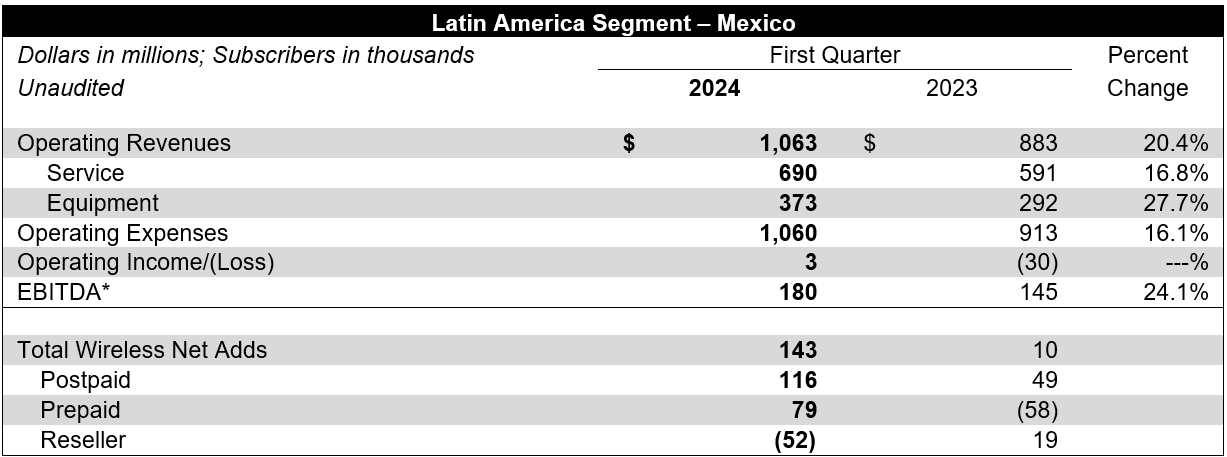
Latin America segment revenues were up 20.4% year over year, primarily due to favorable impacts of foreign exchange rates, higher equipment sales and subscriber growth. Operating expenses were up 16.1% due to unfavorable impact of foreign exchange and higher equipment costs attributable to subscriber growth. Operating income was $3 million compared to ($30) million in the year-ago quarter. EBITDA* was $180 million, up $35 million year over year.
CT Bureau


You must be logged in to post a comment Login