
Headlines of the Day
Telecom services performance Q3 2021, TRAI

TRAI today has released the “Indian Telecom Services Performance Indicator Report” for the Quarter ending 30th September, 2021. This Report provides a broad perspective of the Telecom Services in India and presents the key parameters and growth trends of the Telecom Services as well as Cable TV, DTH & Radio Broadcasting services in India for the period covering 1st July, 2021 to 30th September, 2021 compiled mainly on the basis of information furnished by the Service Providers.

Executive summary
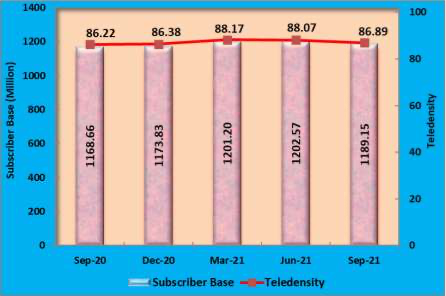
The number of telephone subscribers in India decreased from 1,202.57 million at the end of Jun-21 to 1,189.15 million at the end of Sep-21, registering a decline rate of 1.12% over the previous quarter. This reflects Year-On-Year (Y-O-Y) growth rate of 1.75% over the same quarter of the last year. The overall Tele-density in India decreased from 88.07% as in QE Jun-21 to 86.89% as in QE Sep-21.
Trends in telephone subscribers and tele-density in India:
Telephone subscribers in Urban areas decreased from 666.10 million at the end of Jun-21 to 659.09 million at the end of Sep-21 and Urban Tele- density also decreased from 140.86% to 138.72% during the same period.
Rural telephone subscribers decreased from 536.47 million at the end of Jun-21 to 530.06 million at the end of Sep-21 and Rural Tele-density also decreased from 60.10% to 59.33% during the same period.
Out of the total subscription, the share of Rural subscription decreased from 44.61% at the end of Jun-21 to 44.57% at the end of Sep-21.
Composition of telephone subscribers:

With a net decrease of 14.81 million subscribers during the quarter, the total wireless subscriber base decreased from 1,180.83 million at the end of Jun-21 to 1,166.02 million at the end of Sep-21, registering a decline rate of 1.25% over the previous quarter. On Y-O-Y basis, wireless subscriptions increased at the rate of 1.52% during the year.
Wireless Tele-density decreased from 86.48% at the end of Jun-21 to 85.20% at the end of Sep-21 with quarterly decline rate of 1.48%.
Wireline subscribers increased from 21.74 million at the end of Jun-21 to 23.13 million at the end of Sep-21 with a quarterly growth rate of 6.42% and, on Y-O-Y basis, wireline subscriptions also increased by 15.21% at the end of QE Sep-21.
Wireline Tele-density increased from 1.59% at the end of Jun-21 to 1.69% at the end of Sep-21 with quarterly growth rate of 6.18%.
Total number of Internet1 subscribers increased from 833.71 million at the end of Jun-21 to 834.29 million at the end of Sep-21, registering a quarterly growth rate of 0.07%. Out of 834.29 million internet subscribers, number of Wired Internet subscribers are 24.47 million and number of Wireless Internet subscribers are 809.82 million.
Composition of internet subscription:

The Internet subscriber base is comprised of Broadband2 Internet subscriber base of 794.88 million and Narrowband3 Internet subscriber base of 39.41 million.
The broadband Internet subscriber base increased by 0.27% from 792.78 million at the end of Jun-21 to 794.88 million at the end of Sep-21.
However, the narrowband Internet subscriber base declined by 3.72% from 40.93 million at the end of Jun-21 to 39.41 million at the end of Sep-21.
Monthly Average Revenue per User (ARPU)4 for wireless service increased by 3.34%, from Rs.104.66 in QE Jun-21 to Rs.108.16 in QE Sep-21. On Y- O-Y basis, monthly ARPU for wireless service increased by 11.65% in this quarter.
Prepaid ARPU per month increased from Rs.99 in QE Jun-21 to Rs.102.16 in QE Sep-21, however, Postpaid ARPU per month decreased from Rs.215 in QE Jun-21 to Rs.212.28 in QE Sep-21.
On all India average, the overall Minutes of Usage (MOU)5 per subscriber per month for wireless service increased by 1.74% from 813 in QE Jun-21 to 827 in QE Sep-21.
Prepaid MOU per subscriber per month increased from 822 in QE Jun-21 to 837 in QE Sep-21. Postpaid MOU per subscriber per month increased from 640 in QE Jun-21 to 649 in QE Sep-21.
Gross Revenue6 (GR) and Adjusted Gross Revenue7 (AGR) of Telecom Service Sector for the Q.E. Sep-21 has been Rs.67,300/- Crore and Rs.53,510/- Crore respectively. GR increased by 3.86% and AGR increased by 4.24% in Q.E. Sep-21, as compared to previous quarter.
The Y-O-Y growth in GR and AGR in Q.E. Sep-21 over the same quarter in last year has been -1.36% and 17.07% respectively.
Pass-through8 charges increased from Rs. Rs.13,466 Crore in QE Jun-21 to Rs.13,790 Crore in QE Sep-21 with quarterly growth rate of 2.40%. The Y-O-Y decline rate of 38.77% has been recorded in pass-through charges for QE Sep-21.
The License Fee9 increased from Rs.4,103 Crore for the QE Jun-21 to Rs.4,271 Crore for the QE Sep-21. The quarterly and the Y-O-Y growth rates of license fee are 4.08% and 16.80% respectively in this quarter.
Service-wise composition of Adjusted Gross Revenue:
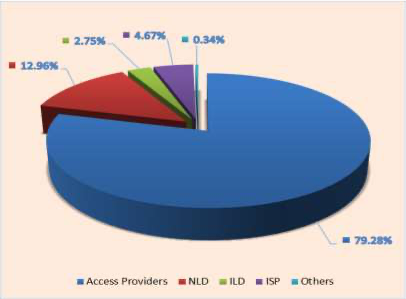
Access services contributed 79.28% of the total Adjusted Gross Revenue of telecom services. In Access services, Gross Revenue (GR), Adjusted Gross Revenue (AGR), License Fee, Spectrum Usage Charges (SUC)10 and Pass Through Charges increased by 4.26%, 3.87%, 3.87%, 6.49% and 5.92% respectively in QE Sep-21.
The performance of wireline service providers in terms of QoS during the quarter vis-à-vis that in the previous quarter is given below: –
| Parameters showing improvement in QoS | Parameters showing deterioration in QoS |
| ❖ % Fault repaired by next working day (for urban areas) ≥ 85%
❖ “Mean time to Repair” (MTTR) ≤10Hs ❖ Accessibility of call centre/ customer care ≥ 95% ❖ %age of calls answered by the operators (voice to voice) within 90 seconds ≥ 95% |
❖ “Fault repair” Fault incidences No. of faults per 100 subs/month) ≤ 7
❖ Time taken for refund of deposits after closures 100% within 60 days |
The performance of Cellular Mobile service providers in terms of Quality of Service (QoS) during the quarter vis-à-vis that in the previous quarter is given as below: –
| Parameters showing improvement in QoS | Parameters showing deterioration in QoS |
| ❖Network QoS DCR Spatial Distribution Measure [Network_ QSD (90,90)]
❖Network QoS DCR Temporal Distribution Measure [Network_ QTD (97,90)] ❖Period of applying credit/ waiver/ adjustment to customer’s account from the date of resolution of complaints ❖Accessibility of call centre/ customer care ❖%age of calls answered by the operators (voice to voice) within 90 Seconds ❖%age requests for Termination / Closure of service complied within 7 days |
❖Worst affected BSes due to down-time (%age)
❖Resolution of billing/charging/validity complaints 100% within 6 weeks |
A total number of 906 private satellite TV channels have been permitted by the Ministry of Information and Broadcasting (MIB) for uplinking only/downlinking only/both uplinking and downlinking, as on 30th September, 2021.
As per the reporting done by broadcasters in pursuance of the Telecommunication (Broadcasting and Cable) Services (Eighth) (Addressable Systems) Tariff Order, 2017 dated 3rd March 2017, as amended, there are 348 satellite pay channels as on 30th September 2021, which include 252 SD (standard definition) satellite pay TV channels and 96 HD (high definition) satellite Pay TV channels.
Since the introduction of DTH Sector in the year 2003, Indian DTH (direct- to-home) services have displayed a phenomenal growth. During the QE 30th September 2021, there were 4 pay DTH service providers in the country.
Pay DTH has attained total active subscriber base of around 68.89 million in QE 30th September 2021. This is in addition the subscribers of DTH Free Dish (free DTH services of Doordarshan).
Apart from the radio stations operated by All India Radio – the public broadcaster, as on 30th September 2021, there are 385 operational private FM Radio stations in 112 cities with operational 34 Private FM Radio broadcasters.
The reported advertisement revenue during the quarter end 30th September 2021 in respect of 385 private FM Radio stations is Rs 294.78 crore as against Rs 148.02 crore in respect of 384 private FM Radio stations for the previous quarter i.e. 30th June 2021.
As per data received from MIB, as on 30th September 2021, 339 Community Radio Stations are operational in the country.
Snapshot:
| (Data as on Q.E. 30th September, 2021) | |
| Telecom Subscribers (Wireless+Wireline) | |
| Total Subscribers | 1,189.15 Million |
| % change over the previous quarter | -1.12% |
| Urban Subscribers | 659.09 Million |
| Rural Subscribers | 530.06 Million |
| Market share of Private Operators | 89.29% |
| Market share of PSU Operators | 10.71% |
| Tele-density | 86.89% |
| Urban Tele-density | 138.72% |
| Rural Tele-density | 59.33% |
| Wireless Subscribers | |
| Total Wireless Subscribers | 1,166.02 Million |
| % change over the previous quarter | -1.25% |
| Urban Subscribers | 637.89 Million |
| Rural Subscribers | 528.13 Million |
| Market share of Private Operators | 89.99% |
| Market share of PSU Operators | 10.01% |
| Tele-density | 85.20% |
| Urban Tele-density | 134.26% |
| Rural Tele-density | 59.11% |
| Total Wireless Data Usage during the quarter | 34,568 PB |
| Number of Public Mobile Radio Trunk Services (PMRTS) | 63,043 |
| Number of Very Small Aperture Terminals (VSAT) | 2,89,557 |
| Wireline Subscribers | |
| Total Wireline Subscribers | 23.13 Million |
| % change over the previous quarter | 6.42% |
| Urban Subscribers | 21.20 Million |
| Rural Subscribers | 1.93 Million |
| Market share of PSU Operators | 45.98% |
| Market share of Private Operators | 54.02% |
| Tele-density | 1.69% |
| Rural Tele-density | 0.22% |
| Urban Tele-density | 4.46% |
| No. of Village Public Telephones (VPT) | 68,606 |
| No. of Public Call Office (PCO) | 81,723 |
| Telecom Financial Data | |
| Gross Revenue (GR) during the quarter | Rs.67,300 Crore |
| % change in GR over the previous quarter | 3.86% |
| Adjusted Gross Revenue (AGR) during the quarter | Rs.53,510 Crore |
| % change in AGR over the previous quarter | 4.24% |
| Share of Public sector undertakings in Access AGR | 5.34% |
| Internet/Broadband Subscribers | |
| Total Internet Subscribers | 834.29 Million |
| % change over previous quarter | 0.07% |
| Narrowband subscribers | 39.41 Million |
| Broadband subscribers | 794.88 Million |
| Wired Internet Subscribers | 24.47 Million |
| Wireless Internet Subscribers | 809.82 Million |
| Urban Internet Subscribers | 497.69 Million |
| Rural Internet Subscribers | 336.60 Million |
| Total Internet Subscribers per 100 population | 60.96 M |
| Urban Internet Subscribers per 100 population | 104.75 |
| Rural Internet Subscribers per 100 population | 37.67 |
| Broadcasting & Cable Services | |
| Number of private satellite TV channels permitted by the Ministry of I&B for uplinking only/downlinking only/both uplinking and downlinking | 906 |
| Number of Pay TV Channels as reported by broadcasters | 348 |
| Number of private FM Radio Stations (excluding All India Radio) | 385 |
| Number of total active subscribers with pay DTH operators | 68.89 Million |
| Number of Operational Community Radio Stations | 339 |
| Number of pay DTH Operators | 4 |
| Revenue & Usage Parameters | |
| Monthly ARPU of Wireless Service | Rs.108.16 |
| Minutes of Usage (MOU) per subscriber per month – Wireless Service | 827 Minutes |
| Total Outgoing Minutes of Usage for Internet Telephony | 187.74 Million |
| Wireless Data Usage | |
| Average Wireless Data Usage per wireless data subscriber per month | 14.73 GB |
| Average revenue realization per subscriber per GB wireless data during the quarter | Rs.9.53 |
CT Bureau


You must be logged in to post a comment Login