
Industry
Slowdown in the networking market-2Q20

IDC has reported a decline in all the segments in 2Q20 and expects that the trend shall not reverse itself in 3Q20.

Networking market
INDIA. The Indian networking market witnessed a 9.6 percent YoY decline in 2Q20 (April-June 2020). IDC expects 3Q20 (July-September 2020) to also follow the same trendline with the lack of business activity in Q2 translating into declined shipments. Decline in the switch market was mainly due to a reduction in investments for campus infrastructure. Business was characterized by regular refreshes from verticals like banking, telecommunications, and professional services. Router market saw a decline of 5.5 percent YoY; however, the quarter-over-quarter (QoQ) decline was only 1.2 percent. The spending from telecom vendors to support remote working needs majorly contributed to the business in this segment.
While Wi-Fi 6 has started to gain significant traction in India, the overall wireless local area network (WLAN) market declined by 4.6 percent. Though the enterprise WLAN market saw a significant drop, it was offset by the growth of consumer gateway routers, that could be attributed to employees working from home and students taking online classes during the lockdown.
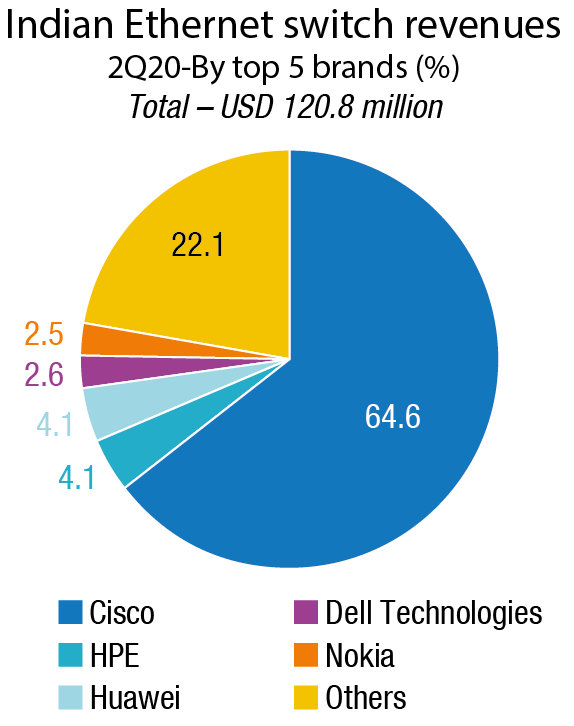 Ethernet switch market. The 2Q20 Ethernet switch market stood at USD 120.8 million (by vendor revenue) registering a YoY decline of 13.8 percent. A sudden drop in campus switch requirements reduced spending across major industry verticals. Supply chain issues were also aggravated due to the complete lockdown that happened during most part of the second quarter. Key industry verticals that contributed to the Q2 business were professional services, telecom, and banking. Except for a few budgeted government deals, most were deferred to later part of the year. Industries like manufacturing and education also saw a significant decline in switching investments. Cisco continued to dominate the Ethernet switch market with a 64.6 percent share during 2Q20, followed by Hewlett Packard Enterprise (HPE) and Huawei.
Router market. The Indian router market in 2Q20 stood at USD 68.4 million (by vendor revenue) with a YoY decline of 5.5 percent. Spending from telecom vendors continued to be steady to support the work from home bandwidth requirements. However, enterprise routing demand declined by 15 percent YoY. Banking and professional services were the key enterprise verticals that contributed to the demand in the second quarter. Cisco led with 65.8 percent market share in 2Q20, followed by Nokia and Juniper.
WLAN market. The Indian WLAN market had a YoY decline of 4.6 percent during 2Q20. The market stood at USD 54.1 million (by vendor revenue) majorly contributed by consumer gateway routers. While enterprise-class WLAN took a significant decline of 18.7 percent YoY, the consumer gateway router demand picked rapidly by 13.1 percent YoY to support the growing demand of employees and students working out of their homes. Lower demand for campus infrastructure caused a steep decline. With a market share of 20 percent, Cisco retained the market leader position during 2Q20, followed by TP-Link and D-Link.

Global. The worldwide Ethernet switch market recorded USD 6.6 billion in revenue in 2Q20, a decrease of 6.3 percent YoY, estimates IDC. Meanwhile, worldwide total enterprise and service provider (SP) router market revenues recorded a slight YoY gain, with a 0.1 percent increase in 2Q20 to nearly USD 4 billion. The global response to the COVID-19 pandemic impacted results across both the Ethernet switch and router markets in the second quarter of 2020. Lockdowns imposed in numerous parts of the world caused many enterprises to pause investment plans. Meanwhile, hyperscalers, cloud providers, and communication service providers increased investments in response to growing demand. This created a dynamic environment with mixed results across various aspects of these markets, a trend that IDC expects to continue in the second half of 2020.
 Ethernet switch market. From a geographic perspective, the Ethernet switch market saw YoY reductions in most global regions. A bright spot was China, which recorded a 25.4 percent YoY increase in 2Q20. The broader Asia/Pacific region (excluding Japan and China) fell by 6.7 percent YoY with Hong Kong’s Ethernet switch market dropping 35.8 percent. Japan’s market was off 3.0 percent from a year earlier. There was also weakness across Europe and the Americas. Western Europe’s Ethernet switch market fell 13.1 percent, with the United Kingdom off 23.4 percent from a year earlier and France losing 20.5 percent. Central and Eastern Europe was down 7.6 percent with Hungary losing 20.1 percent YoY while the Czech Republic grew 17.6 percent. The Middle East and Africa region fell 7.5 percent with Qatar declining 17.1 percent but Israel gaining 7.6 percent. In the Americas, the United States was down 12.5 percent while Canada lost 16.5 percent. The Latin America region fell 22.1 percent with Mexico losing 21.6 percent compared to a year earlier.
Growth in the Ethernet switch market continues to be driven by the highest-speed switching platforms. For example, port shipments for 100Gb switches rose 51.2 percent YoY to 6.7 million units. 100Gb revenues grew 16.3 percent YoY in 2Q20 to nearly USD 1.5 billion, making up 22.4 percent of the market’s overall revenue. 25Gb switches also saw impressive growth with revenues increasing 39.0 percent to USD 505.9 million and port shipments growing 62.2 percent. Lower-speed campus switches, a more mature part of the market, saw mixed results in port shipments and revenue as average selling prices (ASPs) in this segment continue to decline. 10Gb port shipments rose 23.1 percent YoY, but revenue declined 6.1 percent. 10Gb switches make up 28.0 percent of the market’s total revenue. 1Gb switches declined 10.1 percent YoY in port shipments and fell 17.9 percent in revenue. 1Gb now accounts for 35 percent of the total Ethernet switch market’s revenue.
Router market. The worldwide enterprise and service provider router market increased 0.1 percent on a YoY basis in 2Q20, with the major service provider segment, which accounts for 76.9 percent of revenues, growing 1.5 percent and the enterprise segment of the market declining 4.2 percent. From a regional perspective, the combined service provider and enterprise router market grew 18.1 percent YoY in China and was up 20.2 percent in Japan. The broader Asia/Pacific region (excluding Japan and China) fell 5.6 percent YoY. Revenues in Western Europe were off 10.4 percent, while the Central and Eastern Europe combined enterprise and service provider market declined 8.7 percent. The Middle East & Africa region was down 5.7 percent YoY. In the United States, the enterprise segment was down 12.0 percent, while service provider revenues fell 5.9 percent, giving the combined markets a 7.5 percent YoY drop. The Latin American market declined 2.6 percent on an annualized basis.
Cisco finished 2Q20 with a 13.4 percent YoY decline in overall Ethernet switch revenues and market share of 47.2 percent. In the hotly contested 25Gb/100Gb segment, Cisco is the market leader with 35.7 percent of the market’s revenue. Cisco’s combined service provider and enterprise router revenue was down 9.6 percent, with enterprise router revenue decreasing 11.8 percent and SP revenues down 8.1 percent YoY. Cisco’s combined SP and enterprise router market share stands at 33.2 percent. Huawei’s Ethernet switch revenue rose 15.7 percent on an annualized basis, giving the company market share of 12.0 percent. The company’s combined SP and enterprise router revenue increased 16.7 percent YoY, giving the company a market share of 36.3 percent.
Arista Networks saw Ethernet switch revenues decline 17.9 percent in 2Q20, bringing its share to 6.4 percent of the total market. 100Gb revenues account for 72.4 percent of the company’s total revenue, reflecting the company’s longstanding presence at cloud providers and large enterprises. HPE’s Ethernet switch revenue declined 17.3 percent YoY, giving the company a market share of 5.1 percent. Juniper’s Ethernet switch revenue fell 8.2 percent in 2Q20, bringing its market share to 2.8 percent. Juniper saw a 3.3 percent decline in combined enterprise and SP router sales, bringing its market share in the router market to 10.2 percent.
 WLAN market. The combined consumer and enterprise worldwide WLAN market segments rose 7.1 percent YoY in 2Q20. The enterprise segment declined 9.5 percent YoY in 2Q20 with USD 1.4 billion in revenue. The second quarter results reflect the impact of the COVID-19 pandemic on the enterprise WLAN market. With the coronavirus continuing to spread, governments in many regions, imposed quarantines and lockdowns, which presented a headwind for the enterprise WLAN market. Revenues for the enterprise class of WLAN infrastructure have now declined 6.1 percent in the first half of 2020 compared to the same period a year earlier. A driver for the enterprise WLAN market is the Wi-Fi 6 standard, also known as 802.11ax. Across the enterprise market, Wi-Fi 6-enabled dependent access points (APs) made up 28.9 percent of revenues, up from 21.8 percent in the first quarter of 2020 and indicating significant adoption of the newest WLAN standard in the enterprise market. Wi-Fi 6 units accounted for 16.8 percent of shipments, up from 11.8 percent in the previous quarter. The Wi-Fi 5 standard (802.11ac) still makes up the majority of dependent AP shipments (75.6 percent) and revenues (69.4 percent). Overall unit shipments in the enterprise WLAN market fell 6.4 percent compared to 2Q19.
Meanwhile, the consumer WLAN market grew 20.3 percent YoY in 2Q20. Within the consumer market, 60.2 percent of shipments and 73.7 percent of revenues were for 802.11ac products. 802.11ax units made up 3.6 percent of shipments and 9.5 percent of revenues, showing the slow adoption of Wi-Fi 6 in the consumer market. APs supporting the older 802.11n standard still made up 36.2 percent of unit shipments and 16.8 percent of revenues. From a geographic perspective, the WLAN market saw mixed results across the globe in 2Q20. The strongest growth was in Asia, where Japan’s market grew 20.8 percent YoY and China’s market was flat with 0.8 percent annual growth. Across the broader Asia/Pacific region, excluding Japan and China, the market fell 7.6 percent YoY. Within the region, Australia’s market declined 13.6 percent, India’s market dropped 18.7 percent, while Taiwan grew a strong 49.1 percent. Results were mostly down across Europe. In Western Europe, the enterprise market dropped 17.2 percent with Germany down 15.0 percent YoY, the United Kingdom off 23.8 percent, and France down 22.3 percent. Meanwhile the Netherlands was nearly flat with 1.0 percent growth. The Central and Eastern Europe region was down 11.3 percent with Poland off 14.4 percent YoY. In the Middle East and Africa, the market fell 5.7 percent on the year, with Saudi Arabia dropping 18.7 percent on an annualized basis. In the Americas, the United States was off 11.1 percent from one year ago while Canada dropped 14.8 percent YoY. The Latin American market fell 16.2 percent with Brazil declining 17.3 percent compared to 2Q19.
Cisco’s enterprise WLAN revenues decreased 10.9 percent YoY in 2Q20 to USD 626 million. In the first half of 2020, Cisco’s revenues are down 8.9 percent compared to the first half of 2019. Cisco remains the market share leader, finishing the quarter with 44.3 percent share, down from 45.7 percent in 1Q20. HPE-Aruba revenues fell 17.1 percent YoY in 2Q20 and the company’s market share stood at 12.8 percent. Ubiquiti enterprise WLAN revenues fell 5.0 percent YoY. The company’s market share was 7.1 percent, down from 9.5 percent in the previous quarter. CommScope (formerly ARRIS/Ruckus) revenues declined 22.8 percent YoY in 2Q20. The company held 4.9 percent market share in the quarter. Huawei’s revenues rose 2.5 percent YoY in 2Q20 and its market share rose to 6.1 percent from 3.8 percent in the previous quarter (1Q20).
Server market
India. The overall server market in India witnessed a YoY decline of 22.3 percent in terms of vendor revenue to reach USD 272.0 million in 2Q20 versus USD 350.2 million in 2Q19. The x86 server market accounts for 85.6 percent of overall server market in terms of revenue. The contribution to x86 server market continues to come from the professional services, telecommunications, followed by manufacturing and banking verticals. For the telecommunications vertical, spending was observed from several on-going projects and network expansion projects. For the banking sector, spending from nationalized and private banks were focused on digital transformation, business continuity, and providing robust banking platforms to the customers. Manufacturing spend was largely driven by global players for their research related projects during 2Q20.
The x86 server market in terms of revenue declined YoY by 26.0 percent to reach USD 232.9 million in 2Q20from USD 314.8 million in 2Q19. This decline was largely due to lower spend of hyper-scalers compared to 2Q19. Also, banks, telecom, and manufacturing verticals witnessed a sharp YoY revenue decline owing to operational constraints and financial challenges posed due to the pandemic. We expect market recovery in second half of CY2020 owing to deal spill-over and order backlogs. In addition, we observe spend coming from telecom vendors, banks, federal government agencies, and global hyper-scalers to support compute and SaaS requirements of large customers and to support the growing demand for virtual and business continuity solutions.
 The non-x86 server market grew YoY by 10.3 percent to reach USD 39.1 million revenue, in 2Q20. IBM continues to dominate the market accounting for 69.1 percent of revenue share, during 2Q20with revenue of USD 27.0 million. Hewlett Packard Enterprise (HPE) came at second position followed by Oracle with a revenue share of 25.2 percent and 5.7 percent respectively.
In 2Q20, HPE emerged as the top vendor in the India x86 server market with a revenue share of 30.3 percent and a revenue of USD 70.6 million. Key wins for HPE came from telecom vendors, IT and ITeS companies, high-tech semiconductor manufacturing companies, and banking organizations. Dell Technologies came at second spot with a revenue share of 22.9 percent and revenue of USD 53.4 million. Dell Technologies picked up large orders from IT and ITeS customers, manufacturing companies, telecom vendors, and banks. At number three is Cisco with a revenue share of 10 percent and revenue of USD 23.2 million. Lenovo came in fourth accounting for a revenue share of 7.2 percent and revenue of USD 16.7 million.
 Global. Vendor revenue in the worldwide server market grew 19.8 percent YoY to USD 24.0 billion during 2Q20. Worldwide server shipments grew 18.4 percent YoY to nearly 3.2 million units in 2Q20. In terms of server class, volume server revenue was up 22.1 percent to USD 18.7 billion, while midrange server revenue declined 0.4 percent to about USD 3.3 billion and high-end systems grew by 44.1 percent to USD 1.9 billion.
On a geographic basis, the Asia/Pacific region performed very well this quarter growing at a combined 31 percent. China outperformed the competitive set, growing 39.8 percent YoY, followed by Japan at 24.9 percent, and the rest of the region (Asia/Pacific excluding Japan and China) at 13.4 percent. The United States also grew 25 percent YoY while Canada declined 11.2 percent. Latin America was able to grow 15.6 percent while Europe, the Middle East and Africa (EMEA) declined 5.8 percent YoY. Revenue generated from x86 servers increased 17.4 percent in 2Q20 to USD 21.6 billion. Non-x86 servers grew revenues 47.4 percent YoY to around USD 2.4 billion.
HPE/New H3C Group finished the quarter with market share of 14.9 percent while Dell Technologies captured a 13.9 percent share of worldwide revenues. Inspur/Inspur Power Systems took third place with 10.5 percent share and impressive 77 percent YoY growth. Lenovo and IBM tied for fourth with 6.1 percent and 6.0 percent share, respectively. The ODM Direct group of vendors accounted for 28.8 percent of total server revenue at USD 6.9 billion with YoY growth of 63.4 percent and delivered 34.4 percent of all units shipped during the quarter.
External storage market
India. The external storage Indian market witnessed degrowth of 36.8 percent YoY by vendor revenue and stood at USD 63.8 million in 2Q2020. The majority of the YoY decline is due to the impact of COVID-19 resulting in delayed demand for storage across organizations during the quarter.
 All-Flash Arrays contributed 34.9 percent to the overall external storage systems market in 2Q20. Most of the organizations are considering and deploying AFA for their primary workloads to enable better performance and also to address the future data requirements. New age flash solutions such as NVMe and storage class memory would further drive the flash adoption in near future. The entry storage category was the worst impacted as compared to high-end and midrange storage systems in 2Q20. The decreased demand for entry storage was predominantly due to decreased spending from professional services organizations. Multicloud journey is one of the key imperatives across the majority of the organizations to get the best of capabilities from various cloud service providers. Businesses are considering and adopting data management tools to enable them to cloudify their storage to seamlessly move across public clouds, private clouds, and traditional datacenters.
Dell Technologies continued to be the market leader in India’s external OEM storage systems market with a 20.1 percent market share by vendor revenue, followed by Hewlett Packard Enterprise (HPE) with a 19 percent market share in 2Q20.
 Global. The global market revenue for enterprise external OEM storage systems declined 5 percent YoY to just under USD 6.3 billion during 2Q20. Total external OEM storage capacity shipped was up 5.1 percent YoY to 17.1 exabytes during the quarter. Revenue generated by the group of original design manufacturers selling directly to hyperscale datacenters grew 64.1 percent YoY to USD 7.0 billion in 2Q20, while capacity shipped grew 122.1 percent YoY to 74.8 exabytes. Total capacity shipments for the market (external OEM + ODM direct + server-based storage) increased 59.7 percent to 124.6 exabytes.
Flash-based storage systems. The total all flash array market generated USD 2.5 billion in revenue during the quarter, up 7.7 percent YoY. The hybrid flash array market was also worth USD 2.5 billion in revenue, but was down 8.7 percent from 2Q19.
On a geographic basis, China grew the fastest of any region during the quarter, up 18.3 percent YoY, with Canada the only other region to generate growth during the quarter, up 1.1 percent. All other regions declined during the quarter, with Japan down 4.7 percent and EMEA declining 7.8 percent in aggregate. The United States was down 8.7 percent, Asia/Pacific (excluding Japan and China) declined 14.7 percent, and Latin America was down 18.7 percent.
Dell Technologies was the number 1 external enterprise storage systems supplier during the quarter, accounting for 27.0 percent of worldwide revenue. HPE/New H3C group and NetApp finished the quarter in a statistical tie for second with revenue shares of 10.5 percent and 9.8 percent respectively, followed by IBM and Huawei tied for fourth at 8.1 percent and 7.7 percent of quarterly market share.
Now that companies have got over the initial hiccups, and growing demands for strong enterprise network connectivity with mobile workforces, internet of things, and cloud applications from enterprise organizations is emanating, 2021 may bring growth. Various organizations are expected to ramp up networking infrastructure owing to increasing focus on higher bandwidth networks, network modernization with software, and to expand wireless networking capabilities.
Increasing adoption of various advanced technologies such as, IoT among various organizations is expected to proliferate growth of the enterprise networking market, owing to its various features such as high optimization offered by security operations (SecOps) and network operations (NetOps) for strong connectivity within organization.
Rising requirements for efficient network systems that provides high performance, reliability, and security is expected to be another factor to support growth of the target market. In addition, increasing hyper connectivity resulting into high demand for vigilance and efficient management of security breaches across organizations around the globe is another factor expected to support growth of the global enterprise networking market.
However, high complexity during change in network system requested by large scale enterprise having large number of connected devices is a major factor expected to restraint growth of the global market. In addition, requirement of complex code integrity during high resource sharing is another factor expected to hamper growth of target market to a certain extent.


You must be logged in to post a comment Login