
CT Stories
Market performance – 3Q19

In India in 3Q19 (July–September 2019), while the ethernet switch, routers, and wireless local area network (WLAN) segments witnessed a 30.6 percent year-over-year (YoY) decline, the external storage market grew 8 percent YoY, the server market revenues by 0.8 percent, and the smartphone market with 26.5 percent quarter-over-quarter (QoQ) and 9.3 percent YoY growth.

On the global front, whereas the ethernet switch market rose 0.1 percent, router market 0.8 percent, external OEM storage systems market 1.3 percent, and the smartphone market 0.8 percent; the WLAN market revenue fell 1.1 percent and the server market revenue 6.7 percent in the third quarter of 2019.
Indian market
Networking market
 India’s networking market, which includes ethernet switch, routers, and WLAN segments, witnessed a 30.6 percent YoY decline in 3Q19. The decline was majorly contributed by the router segment due to strong investments that happened during 2018. However, when compared with 2Q19, the Indian networking market grew by 13 percent. The growth was mainly because of the enterprises starting to exhaust their yearly IT budgets and governments beginning to start IT procurement post elections.
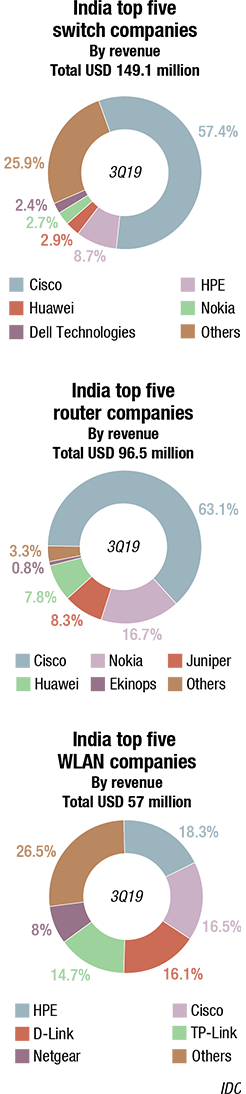
India ethernet switch market 3Q19. The 3Q19 ethernet switch market in India stood at USD 149.1 million (by vendor revenue), registering YoY decline of 7 percent. A decline of 10 percent in the L3 switching segment primarily contributed to the trend. Top spending for switching segment in 3Q19 came from services, telecom finance, and the government. Cisco continued to dominate the ethernet switch market with a 57.4 percent share in 3Q19, followed by Hewlett Packard Enterprise (HPE) and Huawei.
India router market. The India router market in 3Q19 stood at USD 96.5 million (by vendor revenue) with a steep YoY decline of 55 percent. The decline of Router segment in 3Q19 was due to strong investments that happened during 2018. However, in comparison with 2Q19, the router segment grew by 33.3 percent. Cisco leads the router market with 63.1 percent market share in 3Q19 followed by Nokia and Juniper.
Wireless LAN market. The Indian WLAN market had a YoY decline of 6.1 percent during 3Q19. The market stood at USD 57 million (by Vendor Revenue). With a 10.6 percent decline, consumer class deployments were the major cause of this decline. Revenues of WLAN devices are expected to grow in 4Q19 with the launch of Wi-Fi 6 and the upcoming festival season. With a market share of 18.3 percent, Hewlett Packard Enterprise continued to be the market leader in the WLAN segment during 3Q19, followed by Cisco and D-Link.
Forecast. The ethernet switch, router, and WLAN markets are expected to grow in single digits in terms of compound annual growth rate (CAGR) for 2018–2023. Increased adoption of emerging technologies, such as cloud, IOT, mobility, etc., would drive incremental revenues. IDC also expects large investments for 5G rollouts in the next couple of years.
External storage market
India’s External Storage market witnessed a growth of 8 percent YoY, by vendor revenue, and stood at USD 91.8 million in 3Q19. Professional services, banking, government, manufacturing, and telecommunications industries contributed 83.2 percent of overall external storage market in 3Q19.
All Flash Arrays (AFA) witnessed a significant growth of 24.5 percent YoY, which contributed 36.1 percent to the overall external storage systems market in 3Q19. Organizations’ demand for high performance with minimal latency drove the growth for All Flash Arrays (AFA). Also witnessing increased adoption of NVMe-based flash arrays to drive an incremental growth in the coming quarters.
High-End Storage grew by 76.0 percent YoY owing to increased investments from the government, banking, manufacturing, and transportation organizations in 3Q19. Entry Storage segment witnessed 10.3 percent YoY growth, while Midrange Storage segment saw a decline in 3Q19. Dell Technologies continued to be the market leader with a 32.0 percent market share by vendor revenue, followed by Hewlett Packard Enterprise (HPE) with 12.4 percent market share in 3Q19. Hitachi and IBM witnessed strong YoY growth in 3Q19 owing to some key wins from professional services, telecommunication, and transportation sectors.
Forecast. The external enterprise storage systems market is expected to grow at a single-digit CAGR for the 2018–2023 time period. Advent of emerging technologies would drive incremental demand for in the near future.
Server market
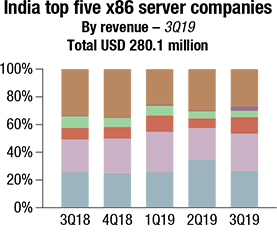
The overall server market in India witnessed a YoY growth of 0.8 percent in terms of revenue to reach USD 280.1 million in CY 3Q19 versus USD 277.8 million in CY 3Q18. This growth is majorly driven by non-x86 server market as it registered big deals from large public and private banks in India during 3Q19.
 The x86 server market in terms of revenue declined YoY by 6.1 percent to reach USD 239.0 million in 3Q19 from USD 254.6 million in 3Q18. Even though the x86 Server market had declined, verticals such as banking, government, and manufacturing grew with the YoY growth of 125.4 percent, 24.0 percent, and 3.5 percent, respectively, in the x86 server market during 3Q19.
The non-x86 server market increased YoY by 77.3 percent to reach USD 41.2 million in revenue, in 3Q19. For the third quarter in 2019, HPE has overtaken IBM and now leads the market with a revenue share of 48.4 percent. IBM stands at the second position with a revenue share of 45.4 percent, followed by Oracle with 6.1 percent during 3Q19. Banking remains the top vertical with 83.2 percent revenue share followed by manufacturing and professional services with 9.9 percent, and 3.1 percent, respectively, during 3Q19.
In 3Q19, HPE and Dell Technologies tied for the number-one position, claiming a revenue share of 27.1 percent and 26.5 percent, respectively. HPE registered a revenue of USD 64.7 million with major deals coming from telco, government, and banking verticals. Dell Technologies registered a revenue of USD 63.4 million with major deals in banking, manufacturing, and telco. Cisco stood at the third position, growing YoY by 24.3 percent and claiming a revenue share of 10.8 percent to reach USD 25.8 million, while Acer Group came fourth at grabbing revenue share of 2.9 percent and a revenue of USD 6.9 million owing to the big win from state ICT development project.
Forecast. The poor performance of the Indian economy is expected to hamper the local manufacturing demand, keeping it low and thereby affecting the IT spend. For 4Q19 and the year 2020, we are expecting government and BFSI investments to have a positive effect on the compute spend. In telco, spend from projects such as OSS, BSS, IMS stack for VoLTE, VRAN, and 5G testbed programs toward 5G development would continue to grow throughout 2020. In addition, local cloud-service providers will continue to invest in expanding their infra capacity in the coming quarters.
Smartphone market
 India’s smartphone market shipped a record 46.6 million units in the third quarter of 2019, with 26.5 percent QoQ and 9.3 percent YoY growth. This was driven by multiple online sale festivals, new model launches, and price corrections on a few key models by various brands.
The offline channel continued to face challenges, leading to a 2.6 percent YoY decline in 3Q19. Even as the offline channel players tried to match their offers in line with the online players, they fell short of the attractive deals that a consumer could grab in the online space, and were still dealing with leftover inventory from previous quarters. Consumer enquiries and footfalls were relatively slow at the retail counters through September, compared to the previous years.
While the low-end price segment of USD 200 still accounted for 80 percent of the overall India smartphone market in 3Q19, its share dropped by five percentage points YoY at the cost of the mid-range segment of USD 200–500, gaining six percentage points to 18.9 percent in 3Q19. The fastest-growing segment in 3Q19 was USD 300–500 with double the shipments YoY, as key models like the OnePlus 7, Redmi K20 Pro and Vivo V15 Pro had good traction. USD 200–300 was the second-fastest-growing segment with 47.8 percent YoY growth in 3Q19, with strong shipments of the Galaxy A50, Redmi Note 7 Pro, and Vivo Z1 Pro. The ASP for the overall smartphone market was USD 159, with 2.7 percent YoY growth in 3Q19.
In the premium (USD 500+) segment, Apple continued to dominate with a market share of 51.3 percent in 3Q19, on the back of affordability offers and price drops on previous-generation models like the iPhone XR, iPhone 8, and iPhone 7 (128GB), along with the newly launched iPhone 11/Pro series.
The feature phone market, accounting for 43.3 percent of the total mobile phone shipments, registered a 17.5 percent YoY decline in 3Q19, with shipments of 35.6 million units during the quarter. 4G-enabled feature phones declined 20.3 percent YoY owing to heavy inventory in the channel. The 2/2.5G market also saw a decline of 16.2 percent in 3Q19.
Top-five smartphone vendor highlights
Xiaomi recorded its highest-ever smartphone shipments in a quarter with 12.6 million units, growing at 8.5 percent YoY. The Redmi 7A and Redmi Note 7 Pro were the highest shipped models in the overall smartphone market. USD 300–500 price segment also gained traction for Xiaomi, driven by the Redmi K20 series. Xiaomi continued to lead in the online channel with a market share of 40 percent in 3Q19, with four out of the five top models from Xiaomi.
Samsung was the only vendor amongst the top five to fall, dropping 8.5 percent YoY in 3Q19. The lag between older Galaxy A series (Galaxy A10, 50, etc.) and the refreshed Galaxy As (Galaxy A10s, A50s, etc.) series just before the Diwali quarter led to this sharp decline. However, newly launched Galaxy M30s registered strong shipments in its opening quarter.
Vivo registered a strong YoY growth of 58.7 percent in 3Q19 on the back of its affordable Y series (Y12, Y91/i). The newly launched exclusive online Z/U series accounted for more than 20 percent of its overall shipments, making Vivo the third-largest online vendor with a market share of 8.2 percent in 3Q19.
Realme climbed to the fourth position in 3Q19, as its shipments grew multifold YoY in 3Q19, driven by heavy shipments of its affordable C2 model and its newly launched 5 and 3i series. The vendor’s online share was at an all-time high of 26.5 percent in 3Q19, up from 16.5 percent in the previous quarter.
OPPO slipped to the fifth position in 3Q19, but with a YoY growth of 92.3 percent. Its A5 was the fifth-highest shipped model in the overall smartphone market. Moreover, OPPO became the second-largest vendor in the fast-growing USD 300–500 segment on the back of its newly launched Reno 2 series. Its online exclusive K series was not able to find traction due to heavy competition by Xiaomi and Realme in that segment.
Global market
Ethernet switch and router market
The worldwide ethernet switch market (Layer 2/3) recorded USD 7.32 billion in revenue in 3Q19, an increase of 0.1 percent YoY. Meanwhile, worldwide total enterprise and service provider (SP) router market revenues grew 0.8 percent YoY in 3Q19 to USD 3.74 billion.
Ethernet switch market. From a geographic perspective, the 3Q19 ethernet switch market delivered mixed results across the globe. The Middle East and Africa region grew 9.3 percent with the region’s largest market, the United Arab Emirates, growing 6.9 percent YoY while Israel’s market grew 18.8 percent. Across Europe, growth was stagnant. The Central and Eastern Europe (CEE) region lost 9.0 percent compared to a year earlier, with Russia dropping 13.9 percent YoY. The Western Europe market fell 6.1 percent with Germany losing 5.6 percent YoY. Denmark was a bright spot in the region with 18.6 percent YoY growth.
The Asia-Pacific (excluding Japan) (APeJ) region grew 1.3 percent YoY. In China, the market grew 4.6 percent YoY while the Philippines rose 25.9 percent. Japan was off 3.8 percent compared to its growth in 3Q18. In Latin America, the market dropped 4.4 percent YoY, while the US market grew 2.6 percent annually, and Canada declined 4.9 percent YoY.
Growth in the ethernet switch market continues to be driven by the highest-speed switching platforms. For example, port shipments for 100Gb switches rose 57.2 percent YoY to 5.6 million. 100Gb revenues grew 32.8 percent YoY in 3Q19 to USD 1.44 billion, making up 19.6 percent of total market revenue compared to 14.8 percent a year earlier. 25Gb switches also saw impressive growth with revenues increasing 69.3 percent to USD 463.4 million and port shipments growing 68.0 percent YoY. Lower-speed campus switches, a more mature part of the market, saw moderate growth in port shipments but declining revenue, pointing to a decrease in average selling prices (ASPs). 10Gb port shipments rose 7.9 percent YoY, but revenue declined 8.7 percent to deliver 26.3 percent of total market revenue. 1Gb switches grew 3.9 percent YoY in port shipments but declined 7.4 percent in revenue. 1Gb now accounts for 39.2 percent of the total Ethernet switch market revenue.
Router market. The worldwide enterprise and service provider router market increased 0.8 percent on a YoY basis in 3Q19 with the major service provider segment, which accounts for 75.5 percent of revenues, decreasing 0.1 percent and the enterprise segment of the market growing 3.6 percent. From a regional perspective, the combined service provider and enterprise router market fell 1.5 percent in APeJ, with the enterprise segment growing 1.5 percent and the service provider segment declining 2.2 percent YoY. Japan’s total market grew 3.9 percent YoY. Revenues in Western Europe were off 7.3 percent YoY while CEE revenues for the combined Enterprise and Service Provider market grew 3.5 percent YoY. The Middle East & Africa region was up 8.9 percent. In the US, the enterprise segment was up 7.3 percent while service provider revenues grew 1.8 percent, giving the combined markets 3.2 percent YoY growth. In Latin America, the market grew 11.7 percent.
Company highlights
Cisco finished 3Q19 with a 5.6 percent YoY decline in overall ethernet switch revenues and market share of 51.3 percent. In the hotly contested 25Gb/100Gb segment, Cisco was the market leader with 38.2 percent revenue share. Cisco’s combined service provider and enterprise router revenue declined 10.6 percent YoY, with enterprise router revenue increasing 3.4 percent and SP revenues falling 18.1 percent. Cisco’s combined SP and enterprise router market share increased to 37.9 percent, up from 36.8 percent in 2Q19.
Huawei’s Ethernet Switch revenue rose 4.4 percent on an annualized basis, giving the company market share of 8.9 percent. The company’s combined SP and Enterprise Router revenue rose 20.6 percent YoY, giving the company a market share of 28.1 percent.
Arista Networks saw ethernet switch revenues increase 14.3 percent in 3Q19, bringing its share to 7.6 percent of the total market, up from 6.6 percent a year earlier. 100Gb revenues accounting for 68.8 percent of the company’s total revenue, indicating the company’s focus on hyperscale and cloud providers.
HPE’s ethernet switch revenue declined 7.0 percent YoY, resulting in overall market share of 5.3 percent.
Juniper’s ethernet switch revenue rose 4.5 percent YoY in 3Q19, bringing its market share to 3.2 percent. Juniper saw a 17.9 percent decline in combined enterprise and SP router sales, bringing its market share in the router market to 10.9 percent.
Enterprise WLAN market
The combined enterprise and consumer WLAN market segments fell 3.6 percent YoY in the third quarter of 2019 (3Q19) with worldwide revenues of USD 3.8 billion. The enterprise segment fell 1.1 percent YoY in 3Q19 to USD 1.62 billion. The market is in a state of transition as a new wireless standard comes to market, but the continued demand for wireless access technologies, combined with new advanced software management and automation capabilities are expected to drive growth in this market moving forward.
The entrance of the 802.11ax wireless standard, also known as Wi-Fi 6, in the market took some share from shipments of previous-generation 802.11ac products. 802.11ac products accounted for 84.8 percent of dependent access-point shipments in the Enterprise segment and 86.2 percent of dependent access-point revenues. 802.11ax products made up 3.1 percent of dependent access point shipments and 6.1 percent of revenues.
Meanwhile, the consumer WLAN market fell 5.3 percent YoY to USD 2.18 billion. Shipments of 802.11ac products accounted for 57.0 percent of units shipped, and 78.1 percent of revenues. The previous-generation 802.11n standard accounted for 42.8 percent of shipments, but only 20.8 percent of revenues.
Results in the enterprise WLAN market were mixed across the globe. The Asia-Pacific region, excluding Japan, was up 3.3 percent annually in 3Q19, with China growing 6.9 percent YoY while the Korean market fell 16.2 percent. Japan’s market dropped 19.8 percent compared to a year earlier.
Growth slowed across Europe in the third quarter. The Central and Eastern Europe region was off 1.7 percent compared to a year earlier, with Russia dropping 6.6 percent. Romania was a bright spot in the region with 11.9 percent growth. The Western Europe region fell 4.5 percent YoY. Germany fell 3.5 percent while the United Kingdom was down 10 percent. The Middle East and Africa region grew 8 percent YoY with growth of 6.7 percent from the United Arab Emirates and 25.5 percent from Qatar.
The Latin America region fell 12.1 percent with Mexico off 17.3 percent YoY. The US market rose 0.1 percent on an annualized basis and was up 0.5 percent sequentially from the second quarter of 2019.
| Worldwide top 5 smartphone assembly market Ranking by volume |
||||||
| 2015 | 2016 | 2017 | 2018 | 1Q19 | 2Q19 | 3Q19 |
| Samsung | Samsung | Samsung | Samsung | Samsung | Samsung | Samsung |
| Foxconn | Foxconn | Foxconn | Foxconn | Foxconn | Foxconn | Foxconn |
| Pegatron | OPPO | OPPO | OPPO | Flex | VIVO | VIVO |
| LG | Pegatron | VIVO | VIVO | VIVO | OPPO | BYD |
| Huaqin | VIVO | Pegatron | Pegatron | OPPO | Huaqin | OPPO |
| The ranking on this list is based on complete knock-down (CKD) assembly, which includes in-house assembly but excludes design without assembly. | ||||||
Company highlights
Cisco’s worldwide enterprise WLAN revenue fell 4.9 percent YoY, but grew 1.9 percent compared to the previous quarter. The company’s market share dropped slightly from 44.9 percent in 2Q19 to 44.2 percent in 3Q19.
HPE-Aruba’s revenues increased 1.3 percent YoY and rose 4.6 percent sequentially. The company’s market share grew to 14.1 percent in 3Q19 from 14.0 percent a quarter earlier.
Ubiquiti’s revenues rose 9.4 percent annually and 8.6 percent sequentially, with the company’s market share growing to 7.1 percent, from 6.8 percent a quarter earlier.
Huawei’s quarterly revenues rose to 11.2 percent YoY and were up 3.7 percent sequentially, giving the company 5.4 percent market share.
CommScope (formerly ARRIS/Ruckus) was off 20.3 percent YoY and was down 6.7 percent compared to 2Q19. That caused the company’s market share to drop from 5.8 percent in the second quarter to 5.2 percent in 3Q19.
External OEM storage systems market
Global spending on enterprise external OEM storage systems grew 1.3 percent YoY to USD 6.6 billion during the third quarter of 2019 (3Q19). Total external OEM storage capacity shipments were up 6.8 percent YoY to 17.3 exabytes during the quarter. Revenue generated by the group of original design manufacturers (ODMs), selling directly to hyperscale datacenters, declined 6.8 percent YoY in 3Q19 to USD 5.8 billion. Total market capacity shipments (External OEM + ODM Direct + Server-Based Storage) declined 13.9 percent to 98.8 exabytes.
By company
Dell Technologies was the largest enterprise external OEM storage systems supplier during the quarter, accounting for 31.5 percent of worldwide revenue. NetApp and HPE/New H3C Group tied for second with 9.9 percent and 9.6 percent of the market, respectively. Huawei, Hitachi, and IBM tied for the fourth position with revenue shares of 7.0 percent, 6.2 percent, and 6.0 percent, respectively. Despite growing and gaining market share during the third quarter, Pure Storage and Lenovo did not finish among the top 5 companies.
Flash-based storage systems highlights. The total All Flash Array (AFA) market generated USD 2.58 billion in revenue during the quarter, up 11.7 percent YoY. The Hybrid Flash Array (HFA) market was worth slightly less than USD 2.54 billion in revenue, down 1.7 percent from 3Q18.
Regional external storage system highlights. On a geographic basis, Asia-Pacific (excluding Japan) grew the fastest of any region, up 12.5 percent YoY. Japan grew 2.5 percent; Europe, the Middle East, and Africa (EMEA) was down 1.0 percent; and the Americas declined 2.7 percent. China as a standalone country grew 20.4 percent YoY in 3Q19.
Server market
Vendor revenue in the worldwide server market declined 6.7 percent YoY to USD 22.0 billion during the third quarter of 2019 (3Q19). Worldwide server shipments declined 3.0 percent YoY to just under 3.1 million units in 3Q19.
| Top 5 companies, worldwide enterprise external OEM storage systems market, 3Q19 (revenues in USD millions) | |||||
| Company | 3Q19 Revenue |
3Q19 Market share |
3Q18 Revenue |
3Q18 Market share |
3Q19/3Q18 Revenue growth |
| Dell & EMC | 2075.8 | 31.5% | 2095.1 | 32.1% | –0.9% |
| NetApp | 651.7 | 9.9% | 808.2 | 12.4% | –19.4% |
| HPE/New H3C Group* | 632.2 | 9.6% | 662.4 | 10.2% | –4.6% |
| Huawei | 463.5 | 7.0% | 309.9 | 4.8% | 49.6% |
| Hitachi | 407.1 | 6.2% | 408.8 | 6.3% | –0.4% |
| IBM | 398.4 | 6.0% | 391.1 | 6.0% | 1.8% |
| Rest of Market | 1971.7 | 29.9% | 1842.7 | 28.3% | 7.0% |
| Total | 6600.4 | 100.0% | 6518.2 | 100.0% | 1.3% |
| *Due to the existing joint venture between HPE and the New H3C Group, IDC is reporting market share on a global level for HPE as “HPE/New H3C Group” since 2Q16. | |||||
| Top 5 companies, worldwide server vendor revenue, market share, and growth, 3Q19
(revenues in USD millions) |
|||||
| Company | 3Q19
Revenue |
3Q19
Market share |
3Q18
Revenue |
3Q18
Market share |
3Q19/3Q18
Revenue growth |
| Dell Technologies | 3779.3 | 17.2% | 4236.0 | 18.0% | –10.8% |
| T1. HPE/New H3C Group* | 3690.8 | 16.8% | 3811.3 | 16.2% | –3.2% |
| Inspur/Inspur Power Systems** | 1973.3 | 9.0% | 1711.8 | 7.3% | 15.3% |
| Lenovo | 1188.3 | 5.4% | 1430.1 | 6.1% | –16.9% |
| Cisco | 1073.2 | 4.9% | 1041.0 | 4.4% | 3.1% |
| ODM Direct | 5816.0 | 26.4% | 6257.2 | 26.5% | –7.1% |
| Rest of Market | 4473.4 | 20.7% | 5091.7 | 21.6% | –12.1% |
| Total | 21994.3 | 100% | 23579.1 | 100% | –6.7% |
| *Due to the existing joint venture between HPE and the New H3C Group, IDC reports external market share on a global level for HPE and New H3C Group as “HPE/New H3C Group” since 2Q16.
**Due to the existing joint venture between IBM and Inspur, IDC reports external market share on a global level for Inspur and Inspur Power Systems as “Inspur/Inspur Power Systems” since 3Q18. |
|||||
In terms of server class, volume server revenue was down 4.0 percent to USD 17.9 billion, while midrange server revenue declined 14.3 percent to USD 3.0 billion and high-end systems contracted by 23.7 percent to USD 1.1 billion.
By company
Dell Technologies and the combined HPE/New H3C Group ended 3Q19 in a statistical tie for the number-one position with 17.2 percent and 16.8 percent revenue share, respectively. Revenues for Dell Technologies declined 10.8 percent YoY while HPE/New H3C Group was down 3.2 percent YoY. The third-ranking server company during the quarter was Inspur/Inspur Power Systems, which captured 9.0 percent market share and grew revenues 15.3 percent YoY. Lenovo and Cisco ended the quarter tied for the fifth position with 5.4 percent and 4.9 percent revenue share, respectively. Lenovo saw revenue decline by 16.9 percent YoY and Cisco saw its revenue grow 3.1 percent YoY.
The ODM direct group of vendors accounted for 26.4 percent of total revenue and declined 7.1 percent YoY to USD 5.82 billion. Dell Technologies led the worldwide server market in terms of unit shipments, accounting for 16.4 percent of all units shipped during the quarter.
Top server market findings. On a geographic basis, Asia-Pacific (excluding Japan) (APeJ) and Japan were the only regions to show growth in 3Q19 with Japan as the fastest at 3.3 percent YoY and APeJ flat at 0.2 percent YoY. Europe, the Middle East and Africa (EMEA) declined 9.6 percent YoY while Canada declined 4.7 percent and Latin America contracted 14.2 percent. The United States was down 10.7 percent YoY. China saw its 3Q19 vendor revenues remain essentially flat with YoY growth of 0.7 percent.
Top 5 smartphone companies, worldwide shipments, market share, and
|
|||||
| Company | 3Q19 Shipments |
3Q19 Market share |
3Q18 Shipments |
3Q18 Market share |
YoY Change |
| Samsung | 78.2 | 21.8% | 72.2 | 20.3% | 8.3% |
| Huawei | 66.6 | 18.6% | 52.0 | 14.6% | 28.2% |
| Apple | 46.6 | 13.0% | 46.9 | 13.2% | –0.6% |
| Xiaomi | 32.7 | 9.1% | 33.8 | 9.5% | –3.3% |
| OPPO | 31.2 | 8.7% | 30.0 | 8.4% | 4.1% |
| Others | 103.0 | 28.7% | 120.7 | 34.0% | –14.7% |
| Total | 358.3 | 100.0% | 355.6 | 100.0% | 0.8% |
| Company shipments are branded device shipments and exclude OEM sales and refurbished units for all vendors. | |||||
Top 5 companies, worldwide server unit shipments, market share, and growth, 3Q19 (shipments in thousands) |
|||||
| Company | 3Q19 Unit shipments |
3Q19 Market share |
3Q18 Unit shipments |
3Q18 Market share |
3Q19/3Q18 Unit growth |
| Dell Technologies | 502306 | 16.4% | 559156 | 17.7% | –10.2% |
| HPE/New H3C Group* | 452255 | 14.7% | 456294 | 14.4% | –0.9% |
| Inspur/Inspur Power Systems** | 314975 | 10.3% | 283613 | 9.0% | 11.1% |
| Lenovo | 204040 | 6.6% | 193121 | 6.1% | 5.7% |
| Huawei | 156150 | 5.1% | 187860 | 5.9% | –16.9% |
| Super Micro | 140171 | 4.6% | 169320 | 5.4% | –17.2% |
| ODM Direct | 896625 | 29.2% | 871476 | 27.5% | 2.9% |
| Rest of Market | 403078 | 13.1% | 443543 | 14.0% | –9.1% |
| Total | 3069601 | 100% | 3164383 | 100% | –3.0% |
| *Due to the existing joint venture between HPE and the New H3C Group, IDC reports external market share on a global level for HPE and New H3C Group as “HPE/New H3C Group” since 2Q16.
**Due to the existing joint venture between IBM and Inspur, IDC reports external market share on a global level for Inspur and Inspur Power Systems as “Inspur/Inspur Power Systems” since 3Q18. |
|||||
Revenue generated from x86 servers decreased 6.2 percent in 3Q19 to USD 20.6 billion. Non-x86 servers declined 13.1 percent YoY to USD 1.4 billion.
Smartphone market
Worldwide smartphone shipments increased 0.8 percent YoY in the third quarter of 2019 (3Q19), reversing seven quarters of decline. In total, companies shipped a total 358.3 million smartphones during the quarter, which was up 8.1 percent from the previous quarter and enough to return the industry to positive growth.
Digging into the growth areas, India led emerging markets in total, which together were responsible for propelling worldwide growth, mainly from the rise of Chinese brands. In China, greater consolidation toward the top five brands was the main trend in the quarter. The top Chinese brands all increased their local shipments in preparation for 11.11 or Singles’ Day, the Chinese equivalent of Black Friday for shopping in the US.
Company highlights
Samsung gained share in 3Q19 with annual growth of 8.3 percent on the back of the Galaxy Note 10 launch in August and increased A series volumes, with a total of 78.2 million smartphones shipped. The lower-end to midrange A series, in particular, helped to fill in the gaps left behind by Huawei.
Huawei shipped higher volumes than expected as it shifted focus to its domestic market, particularly in lower-tier cities, and increased inventories given the unknown future with Google Mobile services. While a sentiment of nationalism has helped to bolster Huawei in China, solid relationships with the local channel players has been the key, offering favorable distributor terms and a well-rounded product portfolio. Nevertheless, there will be challenges ahead with 4G inventory to clear while consumers wait for affordable 5G products to hit the market.
Apple shipped 46.6 million iPhones in 3Q19, which was a slight decline YoY but still better than most expectations. Apple continues to sell some refurbished iPhones via its own channels, which sustain and possibly grow the installed base, but also impact iPhone revenues. Newer iPhones, specifically the iPhone 11s and XR, did very well this quarter, capturing strong share in important markets like the US and Western Europe.
Xiaomi for the first time saw less than a third of its shipments delivered domestically in China, which was second to India in volume. Domestically, despite its launch of the CC series to appeal to young female consumers, shipments declined under pressure from Huawei. The runway was clearer for Xiaomi in India, however, where it strengthened its offline presence by expanding its sales network via the Mi Store and Mi Preferred Partners.
OPPO also focused its attention outside of China as it approached the tipping point of nearly half of its shipments outside of
China, with domestic shipments focused on the Reno series and the A9. India experienced the strongest momentum internationally where the Reno series helped complete its product portfolio with higher-end offerings while the online-exclusive K series strengthened its online presence.
Smartphone assembly market
Smartphone ODM/EMS assembly shipment volumes increased 7.6 percent QoQ during the third quarter of 2019 (3Q19) with total shipments of 358 million units. The increase was largely the result of tier-one vendors moving quickly into lower-priced markets worldwide.
In order to get a cost advantage for low-tier product lines and to keep internal R&D resources for 5G smartphones, Samsung, LG, Nokia, and OPPO are increasing ODM percentages. First-tier Chinese ODMs, such as Wingtech, Huaqin, and Longcheer, will become critical actors in the competitive dynamics of the worldwide smartphone industry in the near future.
Looking ahead, IDC expects smartphone ODM/EMS assembly volumes to increase in the fourth quarter of 2019 owing to rising demand in the upcoming hot season and the launch of 5G SoC chip smartphones.
 Sudharsan Raghunathan
Senior Market Analyst, Enterprise Networking,
IDC India
“The advent of IoT in Indian enterprises has enabled multiple organizations to build use cases around smart processes and improve interoperability. However, increased network speed and lower latencies are crucial for attaining maximum advantage. 5G would act as a catalyst in driving the adoption of IoT, thereby enabling Indian enterprises to revisit their approach toward their existing networking architecture/infrastructure.”
 Dileep Nadimpalli
Research Manager, Enterprise Infrastructure,
IDC India
“Digital transformation has become a key enabler for businesses to thrive in this competitive world. Organizations are exploring ways to adopt newer technologies based on business outcomes rather than CapEx investments. Consumption-based pricing models are expected to have more demand compared to traditional pricing models. The need for infrastructure modernization owing to the advent of digital technologies pushes majority of the organizations to adopt to new-age storage solutions, which can offer better performance, agility, and scalability.”
 Harshal Udatewar
Market Analyst, Server,
IDC India
“Despite poor economic performance and deals getting spilled over, we have noticed verticals such as BFSI, government, and manufacturing driving the growth of overall Server market in India during 3Q19.”
 Upasana Joshi
Associate Research Manager, Client Devices,
IDC India
“The continued aggression by the online platforms with attractive cashback and buyback offers as well as affordability schemes like No-Cost EMIs and financing options were key in taking the share of the online channel to a record high of 45.4 percent with YoY growth of 28.3 percent.”
 Rohit Mehra
Vice President, Network Infrastructure,
IDC
“The over-arching trend driving both the ethernet switch and router markets continues to be enterprise, communications service provider, and cloud SP investments in agile cloud connectivity to meet the needs of their business and customers. The demand for higher speeds across a range of network-connectivity options will spur growth in these markets in the coming years as bandwidth needs increase and mission-critical applications demand even lower latencies.”
 Petr Jirovsky
Research Director,
IDC Networking Trackers
“Dynamics in the ethernet switch and router markets continue to evolve. In ethernet switching, the seemingly insatiable demand for higher-speed networking platforms continues to drive investments. Meanwhile, lower-speed campus switching continues to moderate as enterprises build out connectivity platforms to support mobile workers and the Internet of Things. In the routing segment, the enterprise continues to buoy the broader market as enterprises and service providers augment their networks to support improved cloud connectivity.”
 Brandon Butler
Senior Research Analyst, Enterprise Networks,
IDC
“The enterprise WLAN market is transitioning as vendors and customers begin to adopt the latest Wi-Fi standard. In the third quarter of 2019, IDC tracked the initial shipments of 802.11ax, also known as Wi-Fi 6, which includes numerous features for enterprises and Internet of Things use cases. IDC expects the continued adoption of Wi-Fi 6 to be a major driver of growth for the enterprise WLAN market in the fourth quarter of 2019 and throughout 2020.”
Petr Jirovsky
Research Manager, Worldwide Networking Trackers,
IDC
“The enterprise WLAN marker saw mixed results regionally, in part influenced by macro-economic conditions that continue to disrupt the broader information technology sector. Most notable has been the continued trade standoffs between the United States and China, along with the unresolved Brexit situation and political unrest in Latin America. These macro-economic and political situations create uncertainty for global businesses, which can in turn lead to pausing or scaling back of investments.”
 Greg Macatee
Research Analyst, Infrastructure Platforms and Technologies,
IDC
“While market growth of any kind is always a welcome sight, we see mixed results this quarter. Strong double-digit annual growth of All Flash Array (AFA) sales was required to offset declines in the Hybrid Flash Array (HFA) and HDD-Only markets. Geographic results were also mixed with strong revenue increases in Asia-Pacific, offset by declining revenues in the Americas and EMEA markets.”
Paul Maguranis
Senior Research Analyst, Infrastructure Platforms and Technologies,
IDC
“While the server market did indeed decline last quarter, next-generation workloads and advanced server innovation (e.g., accelerated computing, storage-class memory, next-generation I/O, etc.) keep demand for enterprise compute at near historic highs. In fact, 3Q19 represented the second-biggest quarter for global server unit shipments in more than 16 years, eclipsed only by 3Q18.”
 Melissa Chau
Associate Research Director, Worldwide Mobile Device Trackers,
IDC
“Despite facing challenges across many international markets, Huawei doubled down on China in the third quarter. Samsung benefited the most internationally from Huawei’s woes, ramping up the more affordable A series, while in China the other domestic competitors felt the heat from Huawei.”
 Ryan Reith
Program Vice President, Worldwide Mobile Device Trackers,
IDC
“The market returning to positive growth shows the resilience of this industry as well as the ongoing demand for mobile phones, all in the face of many global macroeconomic challenges. The number of factors in play for competition are incredible. It is clear Huawei continues to make big gains in China, which remains the world’s largest market. Apple beat many expectations and is driving strong volumes in mature markets that face equally challenging headwinds. And most importantly, the top five OEMs accounted for more than 70 percent of the world’s smartphone shipments for the first time ever this quarter. The industry and vendor landscape is still changing but the trend of consolidation is ramping along with it.”


You must be logged in to post a comment Login