
CT Stories
A depressed enterprise networking market ahead

The Indian networking equipment market has declined from USD 1347 million in 2018 to USD 1178.27 million in 2019, registering a de-growth of -14.32 percent. And it is expected that the COVID pandemic will further soften buying behavior, at least during the first half of 2020.

Buyers of networking hardware and software are pulling back on spending worldwide as uncertainty grows over government efforts to stop the novel coronavirus (COVID-19) pandemic.
 The tightening of the purse strings has led IDC to lower its 2020 forecast for the Ethernet switch and wireless LAN markets. The research firm expects the latter to grow by 0.9 percent from 2019, while the former will shrink 0.7 percent. The revised numbers represent a 3.7 percentage point drop from IDC’s earlier forecast for Ethernet switches and a 4.8 percentage point decline for WLAN revenue.
In dollar terms, IDC estimates the switch market will reach USD 28.5 billion this year while WLAN revenue will be USD 6.2 billion.
The latest numbers are not final. The pandemic is far from over, and its impact on global economies remains an exceptionally fluid situation. The analyst firm plans to update its forecasts later in the year.
Industries that have suffered the most from government decrees to send people home include hospitality, transportation, retail, education, manufacturing, sports, and performing arts. Tech buyers will wait until customers return before deciding whether to buy more network infrastructure.
Some industries will buy more network products during the crisis. Healthcare is one, along with communication, cloud, and SaaS providers. Demand for services from the latter three will grow as the number of people working from home soars.
 IDC expects the public health crisis to subside by the third quarter, which should start a rebound in network infrastructure shopping. The analyst firm has enough faith in demand surging that it has not changed its forecasts for 2021.
For example, companies that planned to upgrade their WLANs to the new Wi-Fi 6 standard before the pandemic should restart the projects. That is because those businesses will still need the higher speeds and device support the upgrade provides.
Indian networking market
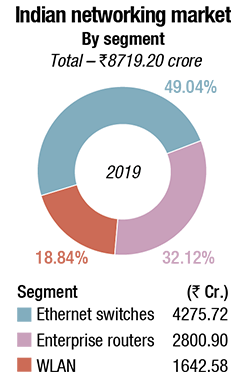
India’s networking market, which includes Ethernet switch, routers, and WLAN segments, is estimated at Rs 8719.2 crore (USD 1178.27 million) in 2019.
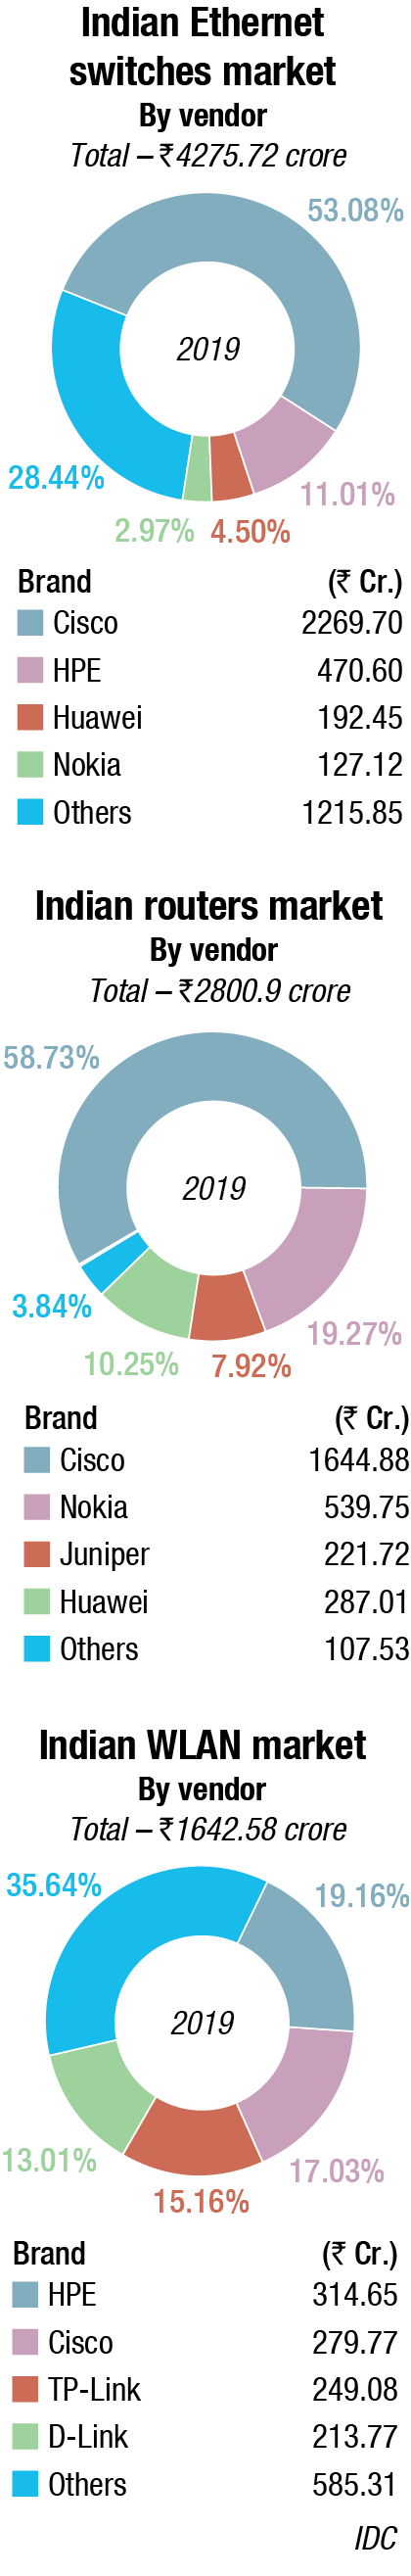
Ethernet switches. The market for Ethernet switches is estimated at Rs 4275.72 crore (USD 577.8 million) in 2019. Top spending for switching segment came from services, telecommunications, finance, and government. Cisco continues to dominate the Ethernet switch market with a 49.9 percent share in 2019, followed by Hewlett Packard Enterprise (HPE) and Huawei.
Enterprise routers. The market for routers is estimated at Rs 2800.9 crore (USD 378.5 million) in 2019, an increase of 0.31 percent from last year. Cisco leads the router market with a 54.3 percent market share in 2019 followed by Nokia and Juniper.
WLAN. The market for WLAN is estimated at Rs 1642.58 crore (USD 221.97 million) in 2019. With a market share of 19.2 percent, HPE continued to be the market leader for the fourth consecutive quarter in the WLAN segment during 2019, followed by Cisco and TP-Link.
Global networking market
The global networking market is estimated at USD 50.5 billion in 2019.
Ethernet switches. The worldwide Ethernet switches market (Layer 2/3) recorded USD 28.8 billion in revenue in 2019, a decline of 2.1 percent year-over-year (YoY). From a geographic perspective, the Ethernet switches market recorded strong growth in the Middle East & Africa segment, which rose 9.8 percent year-over-year in 2019. The United Arab Emirates grew 6.9 percent for the year. The Central & Eastern European region was up 1.7 percent in 2019. Poland’s market in the region rose 11.7 percent for the full year. The Asia-Pacific (excluding Japan) region increased 1.5 percent for the year 2019. The People’s Republic of China, which makes up the largest share of the region’s total, rose 3.6 percent in 2019. Japan rose 4.2 percent for 2019.
Growth in the Ethernet switch market continues to be driven by high-speed switching platforms. 100Gb Ethernet switch revenues grew 18.3 percent of the market. 10GbE-port shipments grew 7 percent YoY while revenues decreased 13 percent. 10GbE made up 27.3 percent of all 2019 Ethernet switching revenues. Meanwhile, 1Gb remains the primary connectivity technology for enterprise campus and branch deployments, making up 40.3 percent of Ethernet switching revenues.
For the full year 2019, Cisco switching revenues were flat, rising 0.1 percent over 2018. Huawei’s Ethernet switch revenue was up 7.8 percent in 2019, compared to 2018. Arista Networks’ Ethernet switching revenue rose 9.8 percent for the full year. HPE Ethernet switch revenues declined 9.1 percent in 2019, putting the company’s full-year market share at 5.4 percent, compared to 6.1 percent at the end of 2018. Juniper’s Ethernet switch revenues declined 7.2 percent in 2019. Juniper finished 2019 with 13.2 percent market share in the service provider routing market, down from 14.7 percent in 2018.
Enterprise routers. The worldwide enterprise and service-provider router market grew 0.4 percent with the service-provider segment falling 1.5 percent and the enterprise segment growing 6.9 percent. The combined enterprise and service-provider router market had mixed results across the world, with APeJ falling 1.1 percent for the full year. Middle East & Africa increased 7.2 percent annually. In the USA, which is the largest worldwide market, revenues were down 3.1 percent for the full year.
 WLAN. The worldwide enterprise wireless local area network segment revenues grew 1.8 percent for the full year 2019, reaching USD 6.2 billion. One of the major advancements in the WLAN market in 2019 has been the introduction of Wi-Fi 6, or 802.11ax. Cisco’s enterprise WLAN revenues grew 1.7 percent above its 2018 revenues. Cisco remains the market-share leader, finishing the year with 44.7 percent share. HPE-Aruba’s revenues rose 1.4 percent for the full year. The company’s market share remained steady at 13.9 percent in 2019, compared to 2018. Ubiquiti’s enterprise WLAN revenues were flat YoY, rising just 0.3 percent; the company’s full year revenues grew 11.5 percent giving Ubiquiti 7 percent share to end the year. Huawei revenues were up 9.9 percent, giving the company 5.5 percent share to end the year. CommScope (formerly ARRIS/Ruckus) saw its revenues decline 17.2 percent for the full year. The company ended 2019 with 5.3 percent market share.
WLAN continues to be an essential technology for almost every organization, regardless of size or geographic presence. The development in recent years of advanced management platforms for these WLAN systems, along with new deployment models in the cloud, has driven growth for this market in recent years.
Outlook
The Ethernet switch, router, and WLAN market is collectively expected to grow in single digit in terms of compound annual growth rate (CAGR) for 2019–2023. Increased adoption of emerging technologies, such as cloud, IoT, and mobility would drive incremental revenues. IDC also expects large investments for 5G rollouts in the next couple of years.
Networking is the backbone for any of the IT-transformation initiatives. Networking systems will need to be more agile and scalable, with better control and security, to enable organizations to adapt quickly to business innovations.
Software-defined networking (SDN) would be of absolute necessity for faster time-to-market and optimizing the network resources. With the advent of SDN and SD-WAN technologies, the landscape of networking architecture is quickly changing. OEMs should address the developing business and deployment models, since the market will adopt subscription-led networking procurement over traditional networking hardware spend.
Increased uptake of hybrid cloud, multi-cloud, mobility and IoT is demanding more networking resources and making day-to-day network operations complex. Organizations are opting for next-generation networking solutions to address automation and orchestration needs, arising owing to complex network environments.
Server and storage market
The global end user spending on IT infrastructure is expected to decline in 2020 as a result of the widespread coronavirus pandemic. Under the current probable scenario, server market revenues will decline 3.4 percent year over year to USD 88.6 billion and external enterprise storage systems (ESS) revenues will decline 5.5 percent to USD 28.7 billion in 2020. The server market is expected to decline 11 percent in Q1 and 8.9 percent in Q2 and then return to growth in the second half of the year. The external ESS market is forecast to decline 7.3 percent in Q1 and 12.4 percent in Q2 before returning to slight growth by the end of 2020 with further recovery expected in 2021.
IDC developed three forecast scenarios (optimistic, probable, and pessimistic) for the impact of COVID-19 on the IT infrastructure markets. The probable scenario assumes a broad negative impact starting in China and spreading into other regions before slowing toward end of the year. Elements of the impact include changing demand expectations from various groups of IT buyers, supply chain shortages, and logistical delays, short-term component price increases, and a suppressed economic and social climate. The current forecast is based on the probable scenario as of March 26, 2020. However, as the situation continues to unfold, the forecasts might be adjusted further.
The fast-changing environment has revealed some remarkable differences in how the pandemic has affected various segments of the market. As the first to be hit by the coronavirus, China will see the greatest negative impact in the first quarter of 2020 while other regions will start to experience the impact in the second quarter. Similarly, some industries (transportation, hospitality, retail, etc.) are facing significantly reduced consumer activity and business closures and others are being hit by an unexpected wave of demand for services, including video streaming, Web conferencing, and online retail. Facing economic uncertainty, many businesses are being forced to consider more expedited adoption of cloud services to fulfill their compute and storage needs. This spike in demand put unplanned pressure on the IT infrastructure in cloud service provider datacenters leading to growing demand for servers and system components. As a result, the IT Infrastructure market has two submarkets going in different directions: decreasing demand from enterprise buyers and increasing demand from cloud service providers. This dynamic is impacting the server market the most, resulting in just a moderate decline for the overall market in 2020. The external storage systems market, with a higher share of enterprise buyers, will experience a deeper decline in 2020.
| Global end-user server revenues (USD millions) |
||||||
| Segment | Category | Value 2019 | Value 2020 | Growth 2020 | Value 2024 | CAGR 2019-2024 |
| Servers | x86 | 83.8 | 81.9 | -2.2% | 109.8 | 5.6% |
| non-x86 | 8.0 | 6.7 | -16.0% | 6.8 | -3.3% | |
| Total Server | 91.7 | 88.6 | -3.4% | 116.6 | 4.9% | |
ICT spending
Worldwide IT spending is now expected to decline 2.7 percent in constant currency terms this year as COVID-19 impacts the global economy and forces many organizations around the world to respond with contingency planning and spending cuts in the short term. In line with previous economic recessions, IT spending on hardware, software, and IT services is likely to decline by more than real GDP overall, as commercial IT buyers and consumers implement rapid cuts to capital spending in line with declining revenues, profits, market valuations, and employee headcounts.
Major spending declines this year are now expected in PCs, tablets, mobile phones, and peripherals with overall devices spending expected to decline by 8.8 percent in constant currency terms. The PC market was already expected to decline on the back of a strong Windows-driven refresh cycle in 2019, but the crisis will significantly disrupt a smartphone market that was projected to post stronger returns this year as a result of 5G upgrades.
Spending on server/storage and network hardware will also decline overall despite strong demand for cloud services as enterprise customers delay purchases during the initial rapid response phase of the current crisis. Total infrastructure spending (including cloud) will increase by 5.3 percent, but all of this growth will come from enterprise spending on infrastructure as a service (IaaS) and cloud provider spending on servers. Meanwhile, overall server/storage hardware spending will be down by 3.3 percent and enterprise network equipment spending will decline by 1.7 percent.
“Hardware spending in general is always identified for rapid spending cuts during any economic crisis, as a means for enterprises to quickly protect short-term profitability,” said Minton. “In previous economic crashes, IT hardware has tended to overshoot the economic cycle on both the downside and in the recovery phase. That is because underlying demand drivers do not change overnight, but the timing of purchases is shifted and delayed, and this can now be done even more quickly than in the past. What is different now is that cloud is a bigger factor than it was in any previous global recession, and this should mean that overall spending is less volatile than in the last two major IT spending downturns.”
IT services spending will decline by 2 percent in 2020, with the worst declines in project-oriented services as organizations hit the pause button on major new projects until business visibility improves. Spending on managed services and support services will also decline, in line with overall IT activities and hardware/software deployments.
Software will post positive growth of just under 2 percent overall, largely due to cloud investments along with some resilient demand for specific categories, which will be a component of response measures or are integral to ongoing business operations.
“There will be pockets of opportunity for software and related services during the next six months, as organizations create response measures focused around increased remote work and collaboration,” said Minton. “Organizations that are further along the digital transformation and cloud migration scales are likely to be best-positioned in terms of integrating these technologies into effective and agile response plans.”
Including telecom and other spending, total ICT spending will decline by 1.6 percent to just under USD 4.1 trillion. This compares to overall ICT growth of 3.5 percent last year, when IT spending increased by almost 5 percent. Telecom spending will be less impacted overall, as demand for broadband remains extremely strong (in some cases, higher as a result of increased working from home and isolation measures).
Augmented and Virtual Reality
 Asia-Pacific spending on augmented reality and virtual reality (AR/VR) is estimated to be USD 3.7 billion in 2019, an increase of 34 percent from the previous year. Asia-Pacific spending on AR/VR products and services will continue this strong growth throughout the five-year period till 2023, with a CAGR of 62 percent. This growth is primarily driven by commercial industries, which are going to be more than USD 11 billion larger than the consumer segment by the end of 2023. Despite this, the consumer segment, which is currently at USD 1.7 billion in 2019, continues to be larger than any other industry segment over the next 5 years.
The high growth in the commercial segment is primarily due to the AR/VR capability to solve complex business problems and streamline operations. The two industries that are seeing the most activities/implementation in Asia-Pacific are education (USD 495.3 million in 2019) and retail (USD 244.4 million in 2019), spending the most in this technology among other industries.
“Specialized training programs in the education system that include VR pilot training through simulations, learning of human anatomy, etc., have given an opportunity to develop a specific skill set in the virtual environment. Leveraging this technology, the chances of making errors will not have fatal consequences during the training process. This has turned out to be a huge transition for institutes to save time for distance-learning purposes and help in reducing cost owing to the travel expenses incurred on students. Similarly, high-end retailers came across improvised customer-engagement programs, using this technology. This has also helped them in delivering the products based on customizing to a specific customer’s choice with the same or less time and effort. The technology has seen an increase in consideration and solutions around online retail showcasing, retail showcasing, and virtual test drive,” says Ritika Srivastava, associate market analyst at IDC India.
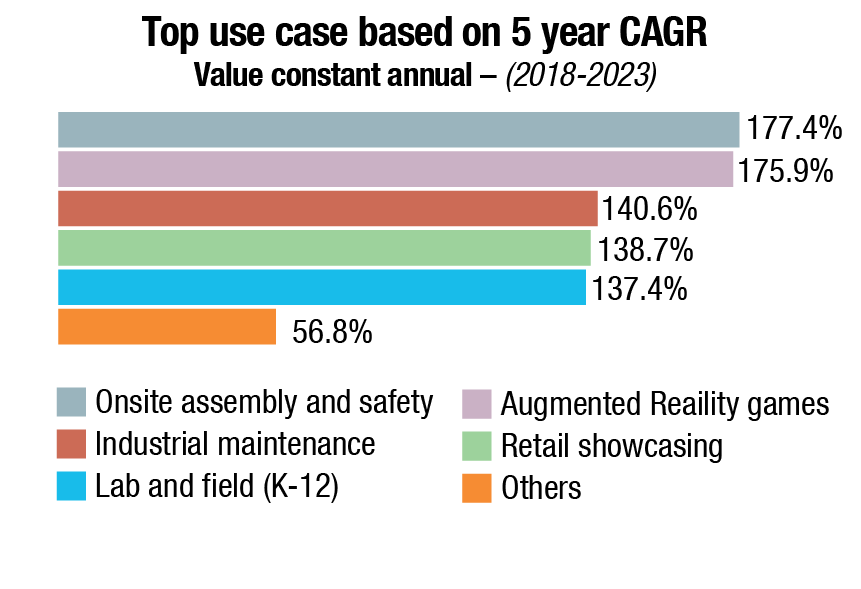
Despite the fact that the two industries have the highest market spend, there are other industries that have high potential to grow at a faster pace with some of the new use cases in the pipeline. Retail (94.8 percent CAGR), followed by utilities, securities, investment services, and process manufacturing, are the industries that are gaining momentum to explore the new use cases, and are lucrative in terms of investments. Use cases that dealt in operational tasks with the help of augmented reality for performing tasks like assembly, maintenance, and repair have a lot of impetus within the industries.
| Global end-user external enterprise storage systems revenues (USD millions) |
||||||
| Segment | Category | Value 2019 | Value 2020 | Growth 2020 | Value 2024 | CAGR 2019-2024 |
| External ESS | External RAID | 30.0 | 28.3 | -5.7% | 32.0 | 1.3% |
| Storage Expansion | 0.4 | 0.5 | 9.6% | 0.4 | -2.4% | |
| Total External ESS | 30.4 | 28.7 | -5.5% | 32.4 | 1.3% | |
With increasing number of enterprises embracing AR/VR technologies for diverse use cases such as retail showcase, assembling, maintenance, indoor navigation in airports, and training, the market outlook for AR/VR will continue to remain strong. As organizations prepare for Future of Work, AR/VR will play a critical role in augmenting workforce capabilities. The ongoing advancements in hardware and software – initiatives and efforts by tech giants such as Google (ARCore), Apple (ARKit 3), and Microsoft (HoloLens) – will open more transformational opportunities, and will further push the wide-spread adoption of AR/VR.
Hardware will account for more than half of all AR/VR spending throughout the forecast, followed by software, and services. Services spending will see strong CAGRs (94.8 percent) for systems integration, followed by consulting services, and custom application development, while software spending will have a (70.0 percent) CAGR.
Of the two reality types, spending in VR solutions will be greater than that for AR solutions initially. However, strong growth in AR hardware, software, and services spending (135.5 percent CAGR) will push overall AR spending well ahead of VR spending by 2023.
On a geographic basis, China market will represent the largest AR/VR spending in the APeJ region with more than 81-percent share in 2019, and the spending is projected to take off at a five-year CAGR of 63.8 percent over the forecast. AR/VR technology in ASEAN countries of Asia-Pacific has started gaining prominence and has partnered with AR/VR enterprises to improve the industry experience.
Basic and managed print services
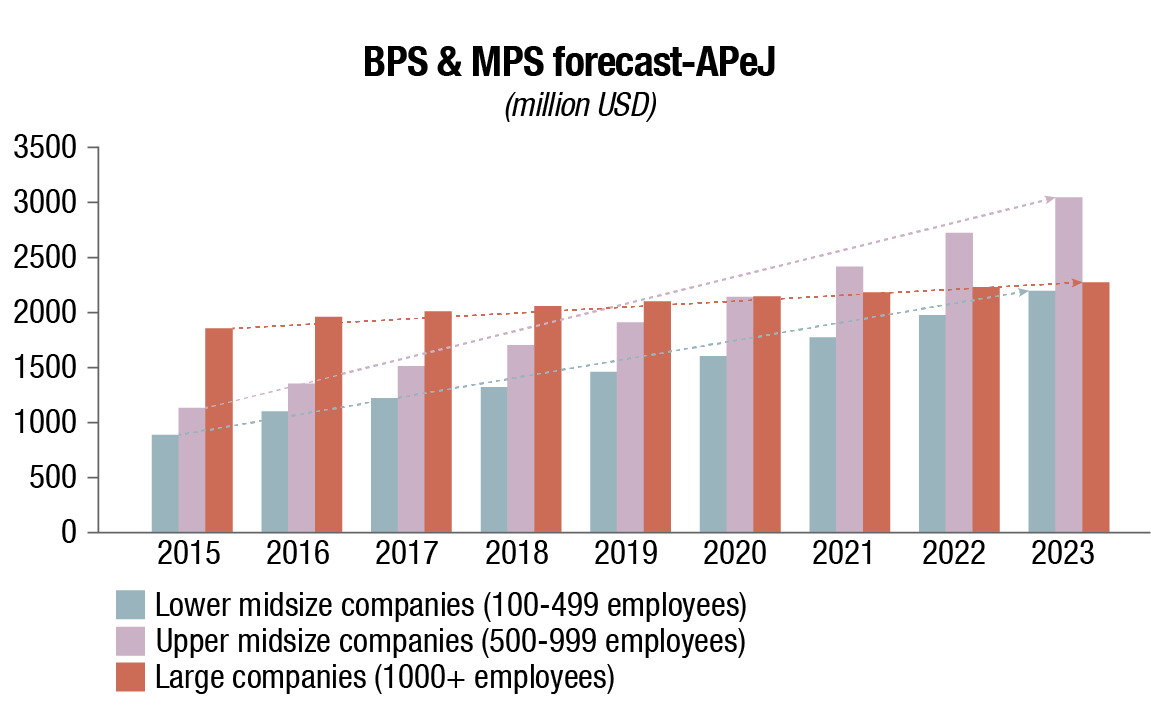 Basic print services (BPS) and managed print services (MPS) are poised to continue growing at a combined rate of 8.2 percent through to 2023 across APeJ. This growth despite BPS and MPS is highly mature in key regions such as North America and Western Europe and APeJ countries of varying levels of digital-technology adoption; positioning APeJ as a vital region for technology vendors looking for growth opportunities.
Despite the maturity of contractual print services in North America and Western Europe, APeJ still presents growth opportunities for BPS and MPS. Countries within the region are at differing levels of digital maturity and vendors should capitalize on this by offering a differentiated strategy for each region that addresses business needs for every stage of digital development.
| Segment | 2019 | 2020 |
| Devices | +0.9 | -8.8 |
| Infrastructure* | +8.8 | +5.3 |
| Software | +10.0 | +1.7 |
| IT Services | +3.9 | -2.0 |
| IT Spending | +4.8 | -2.7 |
| *Infrastructure includes both hardware and cloud services
IT spending growth at constant currency |
||
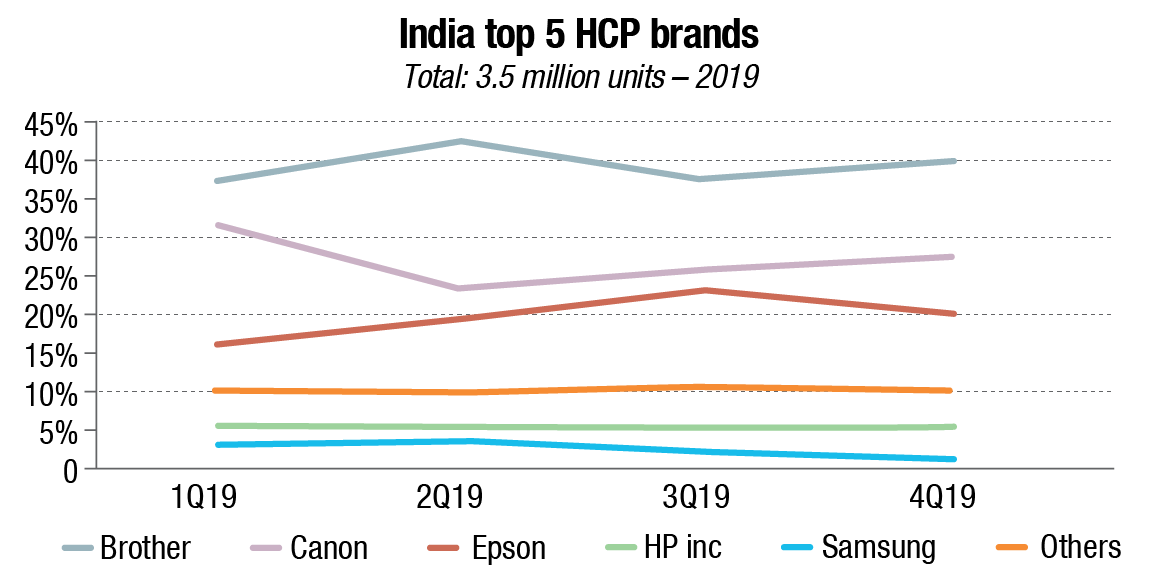
India. The India HCP market shipped 3.5 million units in CY2019 and registered a YoY decline of 4.7 percent owing to weak consumer-segment demand. The annual decline was primarily from laser printers (excluding copiers) declining by 11.8 percent, as the market continued to be impacted by weak demand as well as migration to ink-tank printers. The laser copier market grew by 6.9 percent with strong corporate demand and continuing decline of refurbished copier market. The inkjet market remained stable with a decline of 0.1 percent. The year ended with the inkjet market commanding more than half of the market.
| Total Spend (Growth %) |
|||
| Segment | 2019 | 2020 | 2021 |
| IT | +4.8 | -2.7 | +4.9 |
| Telecom | +1.0 | +0.5 | +1.0 |
| ICT | +3.5 | -1.6 | +3.4 |
| IT spending growth at constant currency | |||
 “Two segments weathered the challenging market conditions in 2019. Ink-tank printers grew by 7.0 percent and now command 73.2 percent of the inkjet market. The ink-tank segment overtook the overall laser-printer segment for the first time in 2H19. The laser-copier segment also noted a growth of 6.9 percent. In 2018, government’s strict regulation on the refurbished copier (RC) market, through tight monitoring and increased seizing of illegal units at major ports, gave a boost to the original copier segment, which continued in 2019 as well. However, by 2H19, the market resumed its normal pace of growth as the effect of RC market stabilized,” says Bani Johri, market analyst, IPDS, IDC India.
Top-three brand highlights
HP Inc. (excluding Samsung) maintained its leadership in CY2019 HCP market with a market share of 39.1 percent, while posting a YoY decline of 7.4 percent. HP’s ink-tank shipment grew by 14 percent YoY as a result of strong channel schemes and end-user promotions. Its laser A4 segment witnessed a decline of 9.7 percent YoY, its highest decline since CY2009. On the bright side, HP’s share in the copier segment grew by 29.4 percent YoY owing to strong channel push.
Epson maintained its second position in the overall CY2019 HCP market with 26.8-percent market share. It also continued to hold its leadership in the inkjet segment with a market share of 45.7 percent and YoY growth of 1.4 percent. Epson’s stable numbers despite muted market sentiments can be primarily attributed to Epson’s strong brand recall, channel depth, and multiple-channel schemes in the first half of the year.
Canon recorded YoY decline of 6.3 percent in CY2019 and maintained its third position in the HCP market. In the copier segment, it maintained its leadership position with a 29-percent unit market share as a result of its strong corporate connect and steady flow of government orders. In the ink-tank segment, Canon witnessed a strong YoY growth of 15.7 percent because of its increased focus on the ink-tank segment with launch of new models, attractive channel schemes, and end-user promotional campaigns. In 2H19, Canon overtook HP to become the second largest player in the ink-tank segment.
Operating in a hybrid multi-cloud environment
| Indian HCP market (million units) |
|||||
| Company | 2019 sales | 2019 share |
2018 sales | 2018 share |
YoY unit change (2019 vs 2018) |
| HP Inc. | 1.39 | 39.1% | 1.50 | 40.2% | -7.4% |
| Epson | 0.95 | 26.8% | 0.95 | 25.5% | 0.0% |
| Canon | 0.70 | 19.9% | 0.75 | 20.2% | -6.3% |
| Others | 0.51 | 14.2% | 0.52 | 14.1% | -1.9% |
| Total | 3.55 | 100.0% | 3.72 | 100.0% | -4.7% |
Half of the enterprises in India are expected to be operating in a hybrid multi-cloud environment by 2021. With organizations progressing on their digital journey, cloud has become the backbone for all new-age technologies. With 95 percent of the organizations planning to increase their cloud spend in the coming 12 months, the adoption of cloud technologies is pertinent for enterprises of all sizes.
While organizations are looking at multiple clouds, they are also simultaneously dealing with the challenges of managing a hybrid multi-cloud environment. For organizations to establish a winning cloud strategy, the operational and management challenges cannot be ignored, and require a strict discipline when it comes to visualize resources and manage overall performance.
Some of the key predictions that would impact the technology buyers and suppliers in cloud technologies and services in India in next three years made by IDC are:
Distributed clouds. By 2021, 50 percent of the enterprises in India will rely on a mix of on-premises/dedicated private clouds, several public clouds, and legacy platforms to meet their infrastructure needs.
Multi-cloud management. By 2022, 30 percent of enterprises in India will deploy unified VMs, Kubernetes, and multicloud management processes and tools to support robust multicloud management and governance across on-premises and public clouds.
Hyperagile apps. By 2023, a third of India enterprise applications will be deployed in a containerized hybrid-cloud/multi-cloud environment to provide agility, delivering a frictionless deployment and management experience.
“Cloud management is a challenge. Organizations are looking for partners that can help them bridge the talent gap, reskill existing staff, and develop access to new resources. India market demands consistent and standardized automated cloud installations, which enable technicians and decision-makers to execute timely assessments cost-effectively,” says Swapnil Shende, senior market analyst for AI, IDC India.
| India smartphone market (million units) |
|||||
| Company | 2019 sales |
2019 share |
2018 sales |
2018 share |
YoY unit change (2019 over 2018) |
| Xiaomi | 43.6 | 28.6% | 39.9 | 28.3% | 9.2% |
| Samsung | 31.0 | 20.3% | 31.9 | 22.6% | -2.8% |
| Vivo | 23.8 | 15.6% | 14.2 | 10.1% | 67.0% |
| OPPO | 16.3 | 10.7% | 10.2 | 7.2% | 60.5% |
| realme | 16.2 | 10.6% | 4.4 | 3.2% | 263.5% |
| Others | 21.6 | 14.2% | 40.5 | 28.6% | -46.6% |
| Total | 152.5 | 100.0% | 141.1 | 100.0% | 8.0% |
Smartphone market
India’s smartphone market shipped 152.5 million units in 2019, with a modest 8 percent YoY growth. India also became the second-largest smartphone market in 2019 after China but was still ahead of USA. The overall mobile phone market, with annual shipments of 282.9 million units, declined by 12.3 percent YoY in 2019 owing to fewer 4G feature phones.
“The online growth momentum continued through the year with a record share of 41.7 percent in 2019, growing by 18.4 percent YoY annually owing to deep discounts, cashback offers, buyback/exchange schemes, and complete-protection offers clubbed with attractive financing schemes like no-cost EMIs across major model line ups and brands,” says Upasana Joshi, associate research manager, Client Devices, IDC India.
2019 also witnessed longer inventory cycles in the offline channel as online exclusive models held back offline sales, resulting in a meagre 1.6-percent annual growth in 2019 in the offline channel.
Used smartphones
Worldwide shipments of used smartphones, inclusive of both officially refurbished and used smartphones, is estimated to reach a total of 206.7 million units in 2019. This represents an increase of 17.6 percent over the 175.8 million units shipped in 2018. Used smartphone shipments are projected to reach 332.9 million units in 2023 with a CAGR of 13.6 percent from 2018 to 2023.
This growth can be attributed to an uptick in demand for used smartphones that offer considerable savings compared with new models. Moreover, OEMs have struggled to produce new models that strike a balance between desirable new features and a price that is seen as reasonable. Looking ahead, the deployment of 5G networks and smartphones is expected to impact the used market as smartphone owners begin to trade in their 4G smartphones for the promise of high-performing 5G devices.
“In contrast to the recent declines in the new-smartphone market, as well as the forecast for minimal growth in new shipments over the next few years, the market for used smartphones shows no signs of slowing down across all parts of the globe. Refurbished and used devices continue to provide cost-effective alternatives to both consumers and businesses that are looking to save money when purchasing a smartphone. Moreover, the ability for vendors to push more affordable refurbished devices in markets, in which they normally would not have a presence, is helping these players grow their brand as well as their ecosystem of apps, services, and accessories,” said Anthony Scarsella, research manager, IDC.
“Although drivers such as regulatory compliance and environmental initiatives are still positively impacting the growth in the used market, the importance of cost-saving for new devices will continue to drive growth. Overall, we feel that the ability to use a previously owned device to fund the purchase of either a new or used device will play the most crucial role in the growth of the refurbished-phone market. Trade-in combined with the increase in financing plans (EIP) will ultimately be the two main drivers of the refurbished-phone market moving forward,” said Will Stofega, program director, Mobile Phones.
The article is based on IDC research conducted over 2019.


You must be logged in to post a comment Login